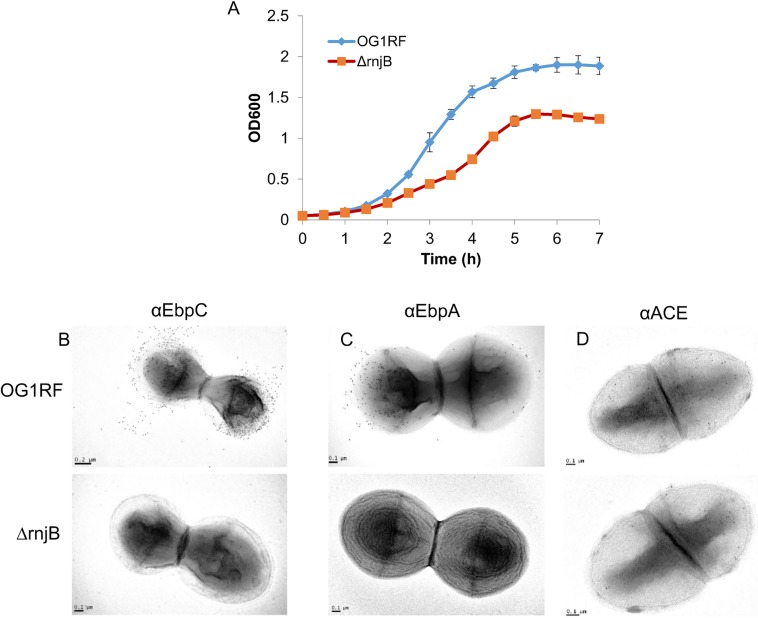
Fig 1. Growth and surface protein expression comparison of OG1RF and ΔrnjB.
(A) Growth rates of OG1RF and ΔrnjB in BHI broth were determined by monitoring OD600. Surface expression of EbpC (B), EbpA (C) and Ace (D) on OG1RF and ΔrnjB were determined by TEM using anti-EbpC mAb 69, anti-EbpA mAb 9, and anti-Ace mAb 70, respectively.

