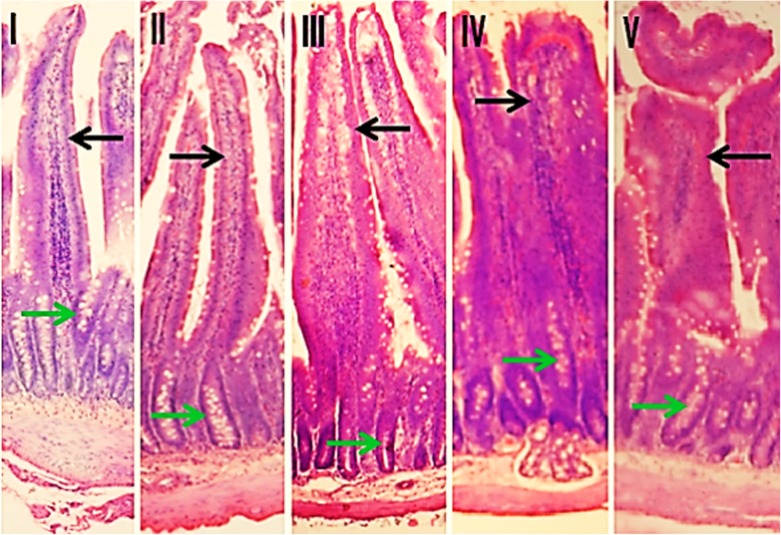
Fig 6. Histopathology of rat intestine.
The image shows intestinal villi and crypt regions from duodenum of [I] control and NaNO2-administered groups [II] 20 mg [III] 40 mg [IV] 60 mg and [V] 75 mg/kg body weight. Black arrows indicate intestinal villi and green arrows indicate intestinal crypts. H and E stain, original magnification is 100x.

