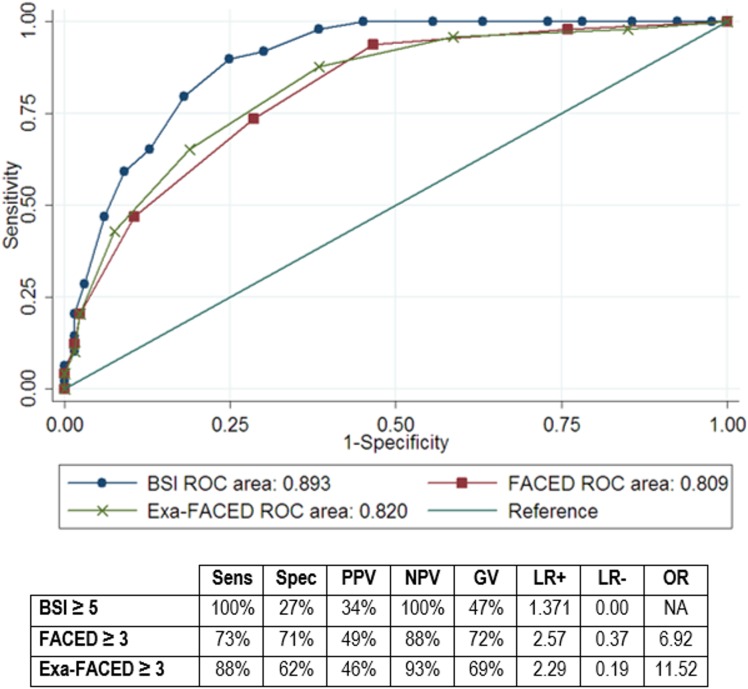
Fig 2. ROC curve for ≥1 hospitalizations at 1-year of follow-up.
Abbreviations: Sens = sensitivity; Spec = specificity; PPV = positive predictive value; NPV = negative predictive value; GV: global value; LR+ = positive likelihood ratio; LR- = negative likelihood ratio; OR = odds ratio; NA = non-available.

