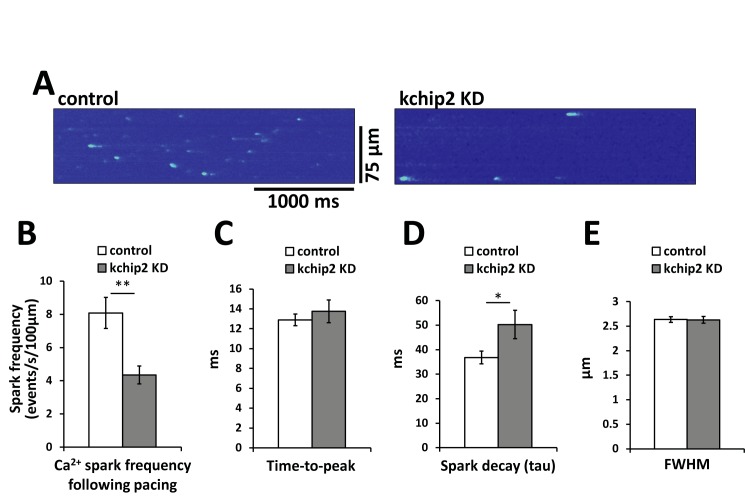
Fig 5. KChIP2 KD results in a significant reduction in spark frequency.
(A) Left panel (Ad.GFP) and right panel (Ad.KChIP KD) show representative recordings of confocal line scan imaging evaluating spontaneous Ca2+ spark activity following 1 Hz field stimulation. Summary data between control (n = 47 cells) and KChIP KD (n = 44 cells) for the (B) spark frequency, (C) Ca2+ spark time-to-peak, (D) decay time of the Ca2+ spark, and (E) full width at half maximum (FWHM) amplitude.

