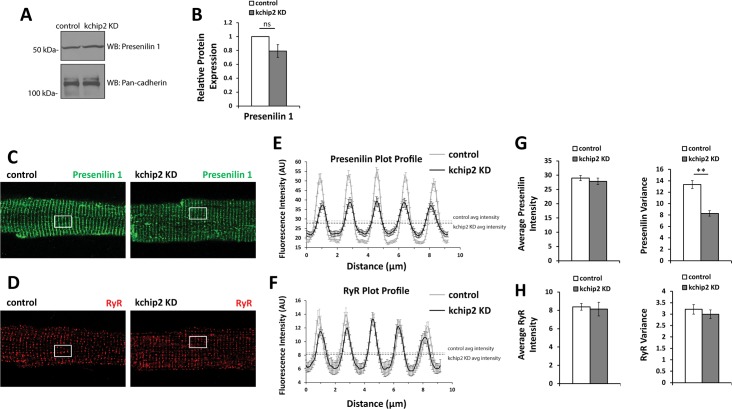
Fig 6. KChIP2 KD associates with a relocalization of presenilin 1 away from sarcomeric structures.
(A) Representative immunoblot for presenilin 1 protein from whole cell lysates for Ad.GFP and Ad.KChIP2 KD treated myocytes. Protein expression was normalized to pan-cadherin expression. (B) Summary data for the average fold change in KChIP2 KD (n = 4) from control (n = 4) showing no reduction in presenilin 1 protein. (C) Representative immunostaining for presenilin 1 protein in Ad.GFP (left panel) and Ad.KChIP2 KD (right panel). Control cells show a strong sarcomeric pattern of expression that is disrupted in KChIP2 KD treated cells. White box represents region of interest selected for evaluating fluorescence intensity in ImageJ. (D) Representative immunostaining for RyR between Ad.GFP (left panel) and Ad.KChIP2 KD (right panel), showing preserved distribution. (E) Average plot profile for presenilin 1 from regions of interest (white boxes) showing the decreased peak intensity at sarcomeres and increased intensity between sarcomeres in Ad.KChIP2 KD (n = 25) compared to Ad.GFP (n = 25) myocytes. Plot profiles were created by the plot profile function within ImageJ. (F) Average plot profile for RyR in the same regions of interest assessed for presenilin 1, shows no change in distribution. (G) Summary data for the average staining intensity for presenilin 1 (left panel) and the variance (standard deviation) in the plot profile (right panel) in the regions of interest. Preservation of the average intensity reflects no change in the amount of presenilin protein, however, a decrease in variance reflects the loss in organization for presenilin 1 protein expression upon KChIP2 KD. (H) The same parameters used to evaluate presenilin 1 distribution but now for RyR, show no change in average intensity or heterogeneity, reflecting no change in RyR localization.

