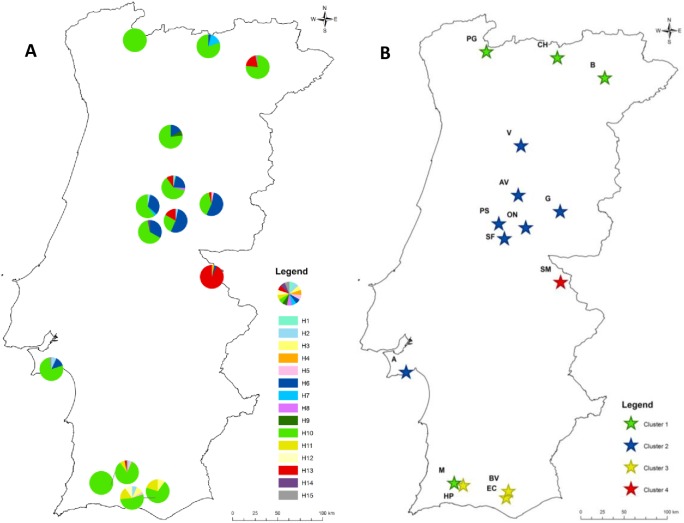
Fig 1. Haplotypes distribution and Bayesian analysis results.
(A) Distribution of the haplotypes in each population. (B) Spatial clustering defined in the BAPS analysis. The best partition displayed 4 clusters: northern, southern and central clusters, and an outlier cluster, the SM population. Cluster 1: [M, PG, CH, B; red star], cluster 2: [HP, BV, EC; green star]; cluster 3: [A, SF, ON, G, AV, PS, V; blue star] and cluster 4: [SM, yellow star]. See Table 1 for population abbreviations.

