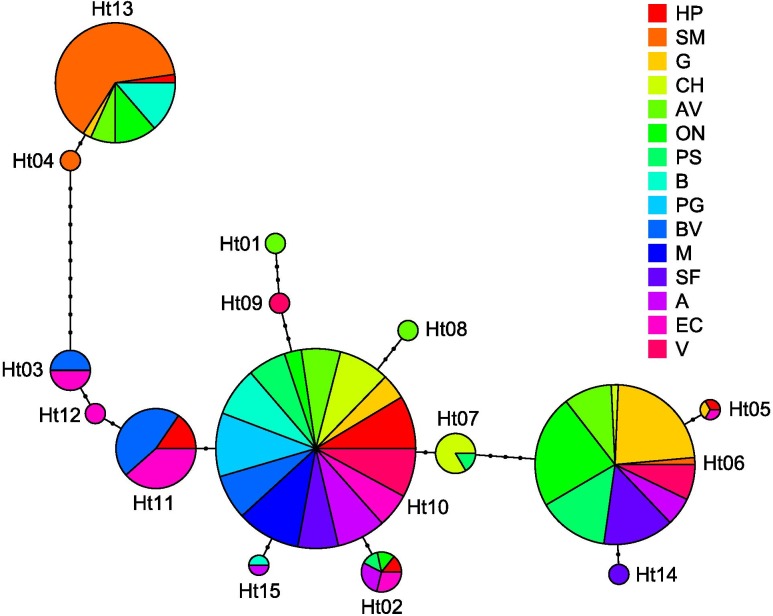
Fig 2. Haplotype network.
The haplotype network is a minimum spanning tree based on the differences in number of repeats. The circles size is proportional to rescaled haplotype frequencies (see M&M for details). Colours indicate in which populations is present each haplotype. In case one haplotype is present in several populations, the circle is divided in circle sectors that are proportional to the number of plants in each population having that haplotype.

