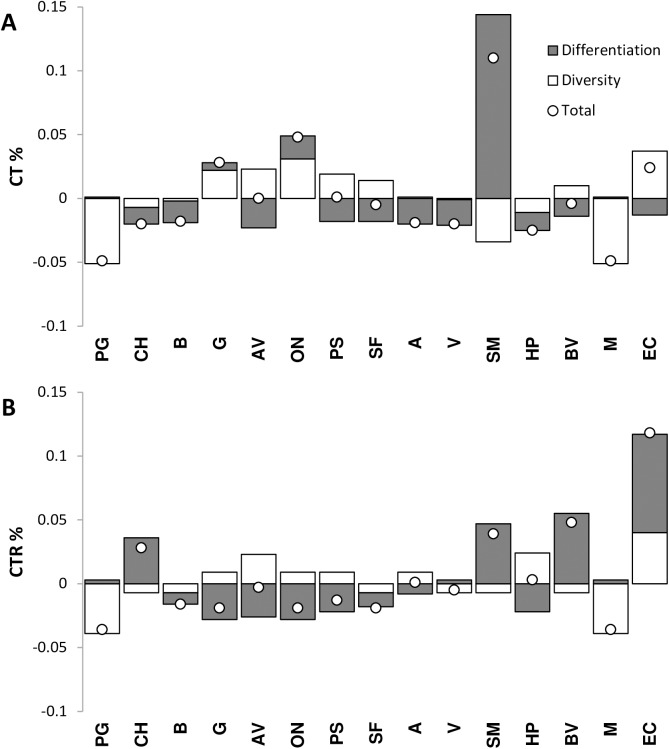
Fig 3. Population diversity partition according to Petit et al. [38].
(A) Contribution to the total diversity (CT%) of each population subdivided into own-diversity (white) and divergence (grey) components. (B) Contribution to the total haplotypic richness (CTR%) of each population subdivided into own-diversity (grey) and divergence (white) components.

