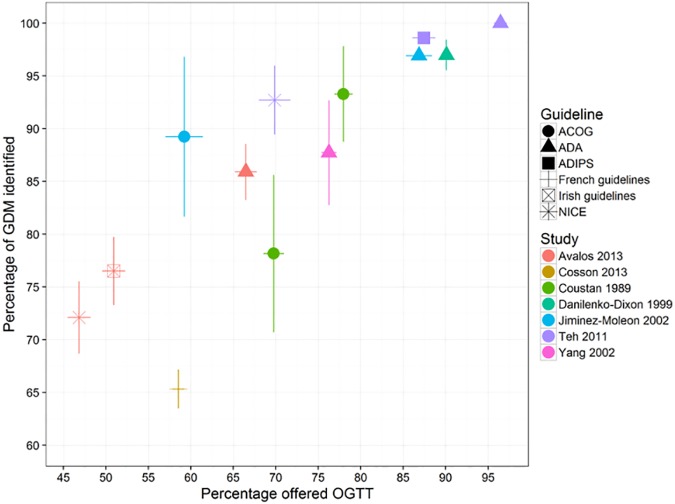
Fig 3. Screening performance of guidelines using a risk factor screening strategy.
Vertical and horizontal lines show the 95% confidence intervals for sensitivity and positive rate respectively. The colour of the points indicates the study. The shape of the points (circles, triangle, square, cross) indicates method used. RF = Risk factor, No = number. ACOG = American College of Obstetricians and Gynecologists. ADA = American Diabetes Association. ADIPS = Australasian Diabetes In Pregnancy Society. NICE = National Institute for Health and Care Excellence. Studies may report more than one performance estimate, this is reflected in the number of coloured shapes for each study.

