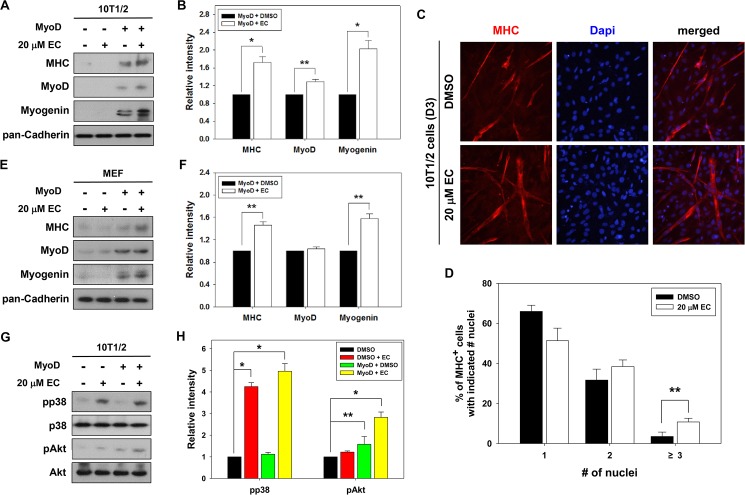
Fig 4. EC augments myogenic differentiation of MyoD-transfected 10T1/2 embryonic fibroblasts.
(A) 10T1/2 cells were transiently transfected with control (pBp) or MyoD expression vector (pBp-MyoD) and induced to differentiate with the treatment of either 20 μM EC or DMSO for 2 days, respectively. Cell lysates were immunoblotted with antibodies to MHC, MyoD, Myogenin and pan-Cadherin as a loading control. (B) Quantification of three independent experiments, similar to data shown in panel A. The signal intensity of myogenic proteins was quantified, and normalized to the loading control pan-Cadherin. The values from control-treated MyoD-transfected cells were set to 1.0. Values represent the means of triplicate determinations ± 1 SD. Significant difference from control, *P < 0.01 and **P < 0.05. (C) 10T1/2 cells transfected with control or MyoD expression vectors were induced to differentiate with treatment of either 20 μM EC or DMSO for 3 days, followed by immunostaining for MHC expression (red) and DAPI staining (blue) to visualize the nuclei. (D) Quantification of myotube formation shown in panel C. Data from three independent experiments were presented as the means ± 1 SD. Asterisks indicate significant difference from the control at **P < 0.05. (E) Primary MEFs were transfected with control (pBp) or MyoD expression vector (pBp-MyoD) and induced to differentiate with treatment of either 20 μM EC or DMSO for 2 days, respectively. Cell lysates were immunoblotted with antibodies to MHC, MyoD, Myogenin and pan-Cadherin as a loading control. (F) Quantification of three independent experiments, similar to data shown in panel E. The signal intensity of myogenic proteins was quantified and normalized to the loading control. The values from control-treated MyoD–transfected cells were set to 1.0. Values represent the means of triplicate determinations ± 1 SD. Significant difference from control, *P < 0.01 and **P < 0.05. (G) Cell lysates shown in panel A were subjected to immunoblotting with antibodies to pp38, p38, pAkt, and Akt. (H) Quantification of three experiments performed as shown in panel G. The signal intensity of pp38, p38, pAkt, and Akt proteins were quantified, and the relative values for the phosphorylated forms to total p38 and Akt proteins were determined, respectively. The values from DMSO-treated control cells were set to 1.0. Values represent the means of triplicate determinations ± 1 SD. Significant difference from control, *P < 0.01 and **P < 0.05.

