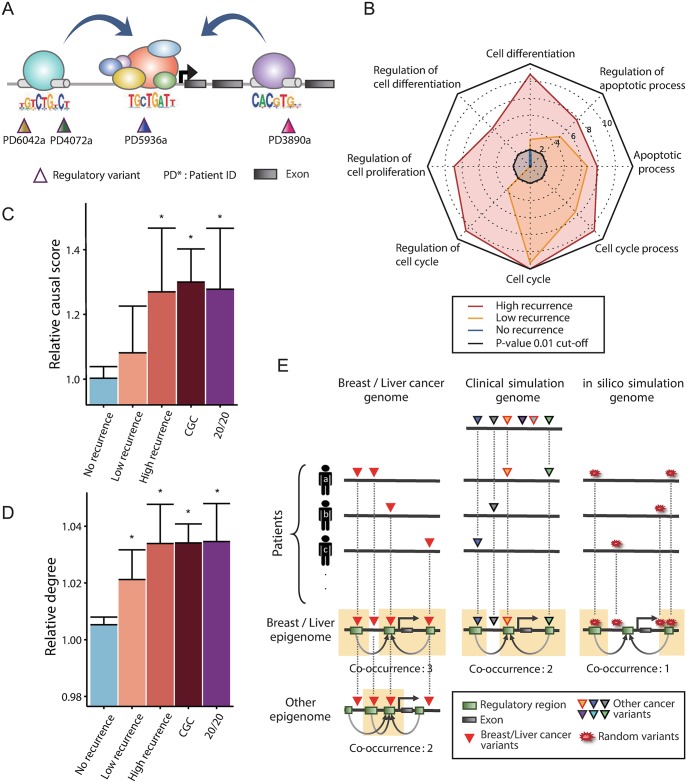
Fig 1. Combinatorial cis-regulatory recurrence.
(A) Illustration of our recurrence model. Four variants from different samples are scattered in cis-regulatory regions but converge on the same gene via chromatin interactions. (B) A radar plot showing the significance of enrichment for eight cancer-related Gene Ontology terms. The length of the plot scales with log10 (P value). The P values were derived from the hypergeometric distribution and adjusted for multiple testing by the Bonferroni correction. (C) Relative causal score of the TDs grouped by the recurrence level and the CDs (CGC and 20/20) in the Bayesian network of breast cancer. Causal scores were calculated as described in the Methods and normalized by dividing by the average causal score of all genes in the network. (D) The relative degree of the TDs and CDs in the coexpression network in breast cancer. The degree was divided by the network average. (E) Schematic illustration of genomic simulation (in silico or clinical) in which variants are randomized, and epigenomic simulation in which K562 chromatin interactome is used in place of MCF-7 and HepG2.

