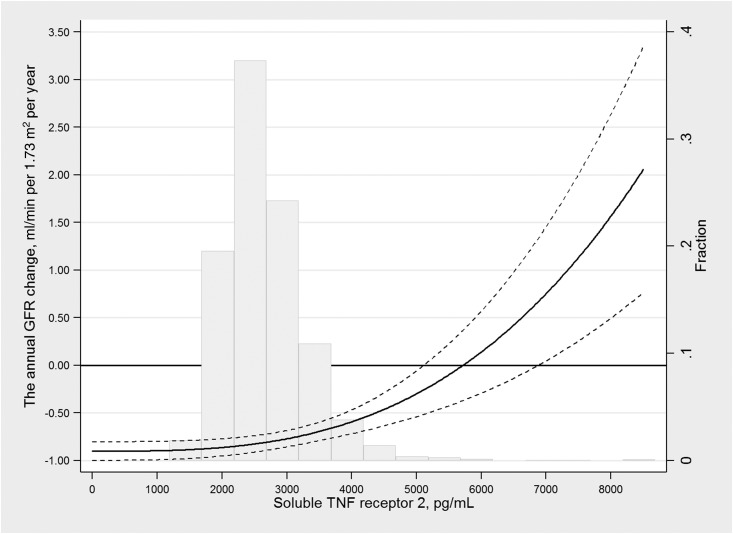
Figure 3.
Soluble TNF receptor 2 associates non-linearly with the annual GFR change as found in a linear mixed model using transformation with a second-degree fractional polynomial model. Dashed lines indicate 95% confidence intervals. The analyses were adjusted for sex; baseline weight and height; systolic BP; LDL cholesterol; HDL cholesterol; fasting triglycerides; hemoglobin A1c; urinary albumin-to-creatinine ratio; number of cigarettes currently smoked; the use of angiotensin-converting enzyme inhibitors, angiotensin receptor blockers, and nonsteroidal anti-inflammatory drugs; and a dichotomous variable for the weekly use of alcohol. The distribution of soluble TNF receptor 2 in the study population is superimposed on the graph.

