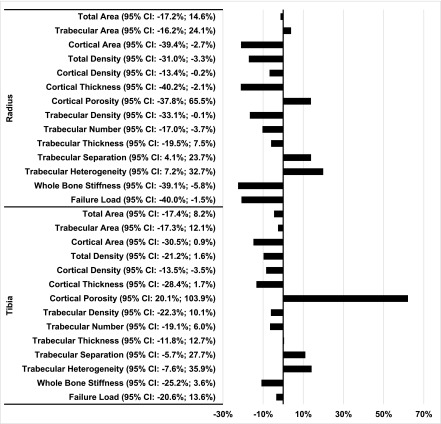
Figure 3.
Despite having bone mineral density in the nonosteoporotic range (T Score > −2.5), patients with a high risk TBS measure had cortical and trabecular microarchitectural features that are associated with increased risk of fracture, and had lower estimates of bone strength by finite element analysis. Percentage difference in trabecular and cortical geometry, density, microarchitecture, and strength at the radius and tibia by high-resolution peripheral computed tomography (HR-pQCT) in patients with lumbar spine T scores >−2.5 stratified by trabecular bone score (TBS) classified as high (TBS<1.37) or normal (≥1.37) fracture risk 12 months after kidney transplantation. Percentage difference = ((HR-pQCT measure at TBS<1.37)−(HR-pQCT measure at TBS≥1.37)/(HR-pQCT measure at TBS≥1.37))×100. 95% CI, 95% confidence interval.

