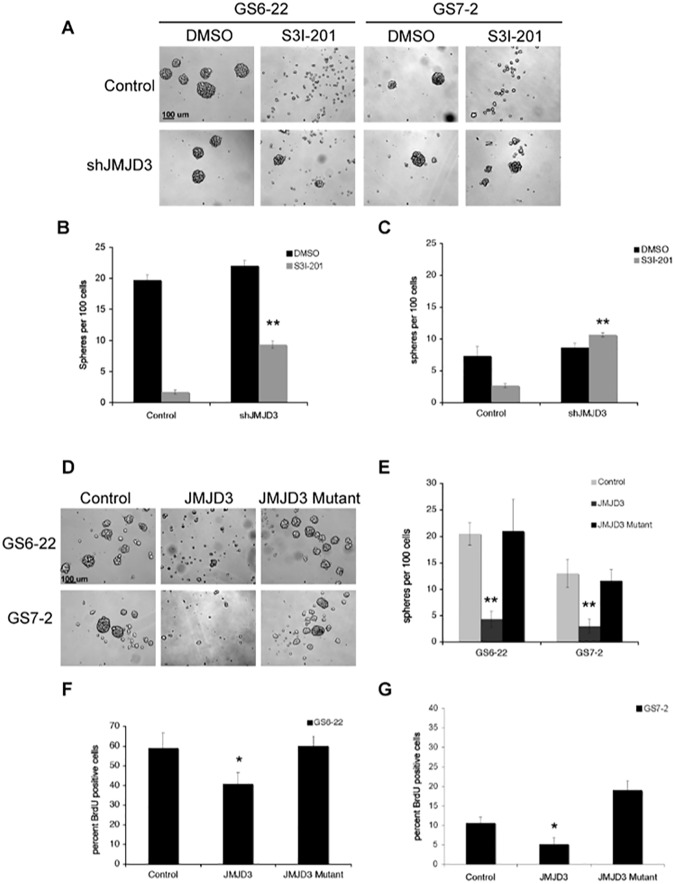
Fig 2. STAT3 controls GBM-SC neurosphere formation and proliferation through repression of Jmjd3.
A. Knockdown of Jmjd3 rescues neurosphere formation in the presence of S3I-201. Representative images of GS6-22 and GS7-2 cells infected with either control or shJmjd3 containing lentivirus treated with DMSO or S3I-201 (50 μM). Images for GS6-22 cells were taken after 6 days and GS7-2 cells were taken after 4 days, based on differences in sphere formation rate in these lines. B. Quantification of neurosphere formation in GS6-22 cells. After 6 days of inhibitor treatment, the number of spheres per 100 cells was counted. Values represent the mean of triplicates within each treatment; bars SE (**p<0.01). C. After 4 days of inhibitor treatment, GS7-2 cell sphere formation was quantified as described for GS6-22 cells. Values represent the mean of triplicates within each treatment; bars SE (**p<0.01 relative to DMSO control, upon shJMJD3 infection). D. Representative images of GS6-22 and GS7-2 cells infected with overexpression retrovirus containing either a control (empty) plasmid, Jmjd3, or a catalytic domain mutant of Jmjd3. After three days of selection, cells were dissociated and replated at 100 cells per ml. Pictures were taken at 50X seven days after replating. E. Quantification of neurosphere formation capacity in GS6-22 and GS7-2 cells infected with the Jmjd3 overexpression retrovirus. Neurosphere formation assay was performed in triplicate (**p<0.01). F. GS6-22 and G. GS7-2 cells were infected with either control, Jmjd3, or Jmjd3 mutant retroviruses as previously described. Cells were pulsed with 30 μM BrdU for 16 hours. After 24 hours, cells were fixed and stained with an anti-BrdU antibody. Cells were also stained with 7-AAD at this time. The percentage of BrdU positive cells was analyzed using flow cytometry. Values represent the mean of 3 experiments; bars SD of the mean (*p<0.05).

