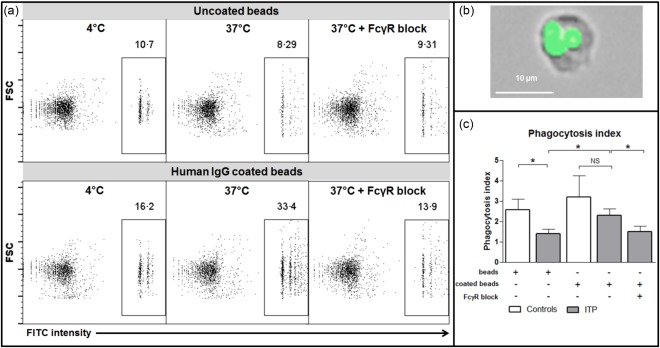
Figure 2.

Splenic macrophage phagocytic functions. To assess their phagocytic capability, macrophages isolated from the spleen of three controls and six immune thrombocytopenia (ITP) patients were incubated with fluorospheres either uncoated or coated with human immunoglobulin (Ig)G at 4°C and 37°C. For some experiments, a FcγR blocking agent was added. (a) The percentage of phagocytosis was determined by flow cytometry. (b) The localization of fluorospheres within macrophages was confirmed by fluorescence microscopy. (c) Phagocytosis index measured is summarized by histograms (mean with standard error of the mean). P‐value derived by Student's t‐test or paired t‐test, as appropriate; n.s. = non‐significant; *P < 0·05. [Colour figure can be viewed at wileyonlinelibrary.com].
