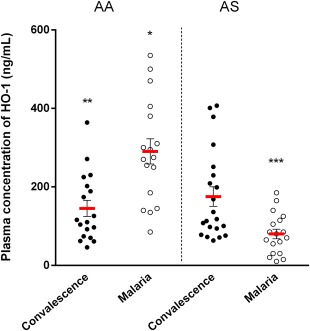
Figure 5.

Comparison of plasma concentration of haemoxygenase‐1 (HO‐1)at baseline and during malaria infection between both genotypical groups. Plasma concentration of HO‐1 was measured by enzyme‐linked immunosorbent assay (ELISA) in duplicate wells for each sample. Data are presented as scatter‐plots. Red line across indicates the mean, while error bars indicate standard error of the mean. Plasma concentration of HO‐1 did not differ at baseline (convalescence) between the two genotypes (P = 0·750 for AA versus AS at convalescence). Patients with the HbAA genotype had higher plasma concentration of HO‐1 compared with patients with HbAS genotype during malaria infection (*P < 0·001 for AA versus AS during acute malaria). Plasma concentration of HO‐1 increased significantly in patients with the HbAA genotype during malaria infection (**P < 0·001 for convalescence versus malaria), while it decreased in patients with the HbAS genotype during malaria infection (***P = 0·006 for convalescence versus malaria) (Student's t‐test). [Colour figure can be viewed at wileyonlinelibrary.com]
