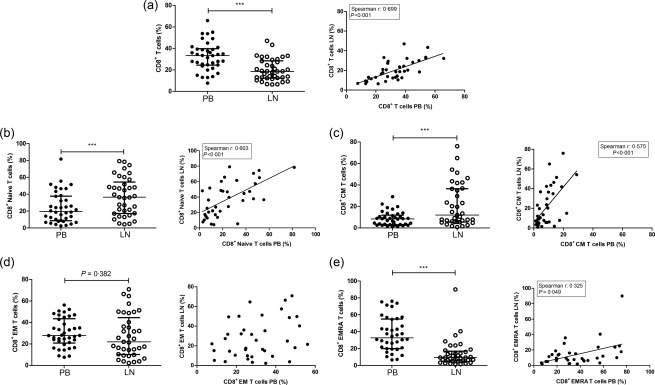
Figure 2.

CD8+ T cell subsets in the peripheral blood (PB) and the lymph node (LN) and the correlation between PB and LN. The frequencies and correlations of (a) CD8+ T cells within CD3+ T cells, (b) CD8+ naive T cells within CD8+ T cells, (c) CD8+ central memory (CM) T cells within CD8+ T cells, (d) CD8+ effector memory (EM) T cells within CD8+ T cells and (e) CD8+ effector memory CD45RA+ (EMRA) T cells within CD8+ T cells are represented. Frequencies of cells are depicted as individual percentages as well as median and interquartile range (left plots). A Spearman's rho was shown only when a significant correlation was present; n = 38 for peripheral blood and n = 38/37 for lymph node samples. Significant differences were calculated and shown (*P < 0·05; **P ≤ 0·01; ***P ≤ 0·001).
