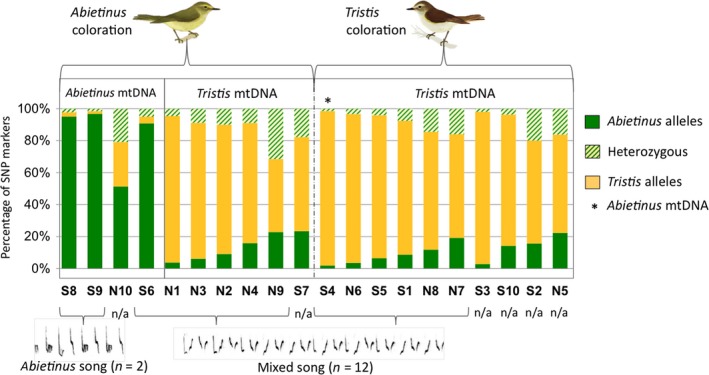
Figure 2.

The proportion of diagnostic SNPs in the 20 samples from the sympatric zone that were selected for whole‐genome sequencing. The bars indicate the proportions that are of either abietinus (green) or tristis (yellow) origin. The fraction of heterozygous SNPs in an individual is marked with barred green. Samples are grouped by morphotype, mtDNA haplotype, and song type. Individuals S1–S10 are samples from the southern sympatric region, and individuals N1–N10 are samples from the northern sympatric region
