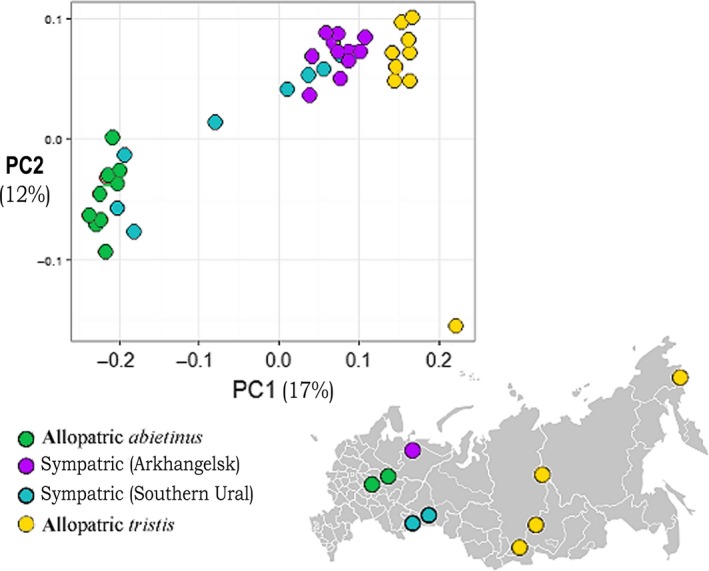
Figure 3.

Principal component analysis (PCA) illustrating the genetic differentiation across samples from both the allopatric (green = abietinus (A1–A10), yellow = tristis (T1–T10)), and the sympatric (purple = samples from N. sympatric zone (N1–N10), blue = samples from S. sympatric zone (S1–S10)) regions (n = 18,014 SNPs). The map illustrates the geographic locations of samples from each respective group
