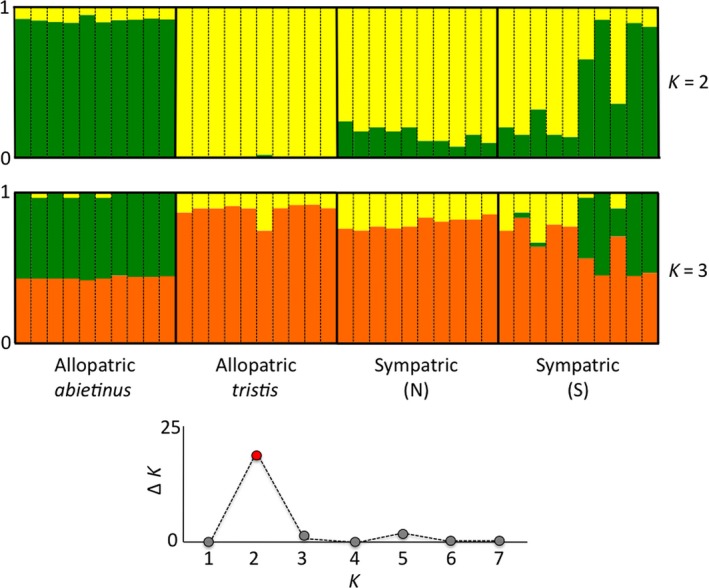
Figure 4.

Illustration of the STRUCTURE analysis using the high‐stringency data set (n = 18,014 SNPs) for K = 2 (top panel) and K = 3 (bottom panel) clusters. The allopatric samples are represented in Sections 1 (abietinus: A1–A10) and 2 (tristis: T1–T10), and samples from the sympatric region are presented in sections 3 (North: N1–N10) and 4 (South: S1–S10). The graph at the bottom shows the evaluation of optimal K from K = 1 to K = 7 as described in Evanno et al. (2005)
