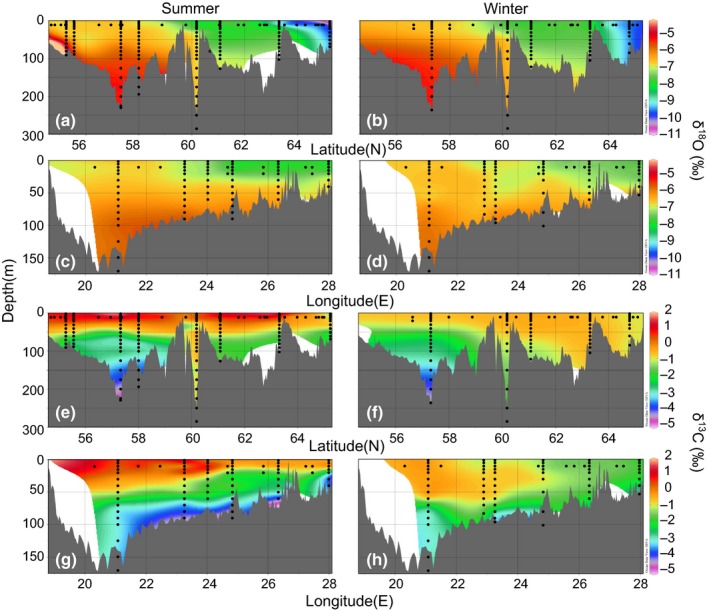
Figure 4.

Interpolated cross‐sectional surfaces of vertical and δ13 CDIC values. values from south to north in (a) summer and (b) winter, and from west to east in (c) summer and (d) winter. δ13 CDIC values, from south to north in (e) summer and (f) winter, and from west to east in (g) summer and (h) winter. Black dots represent sampling locations and depths
