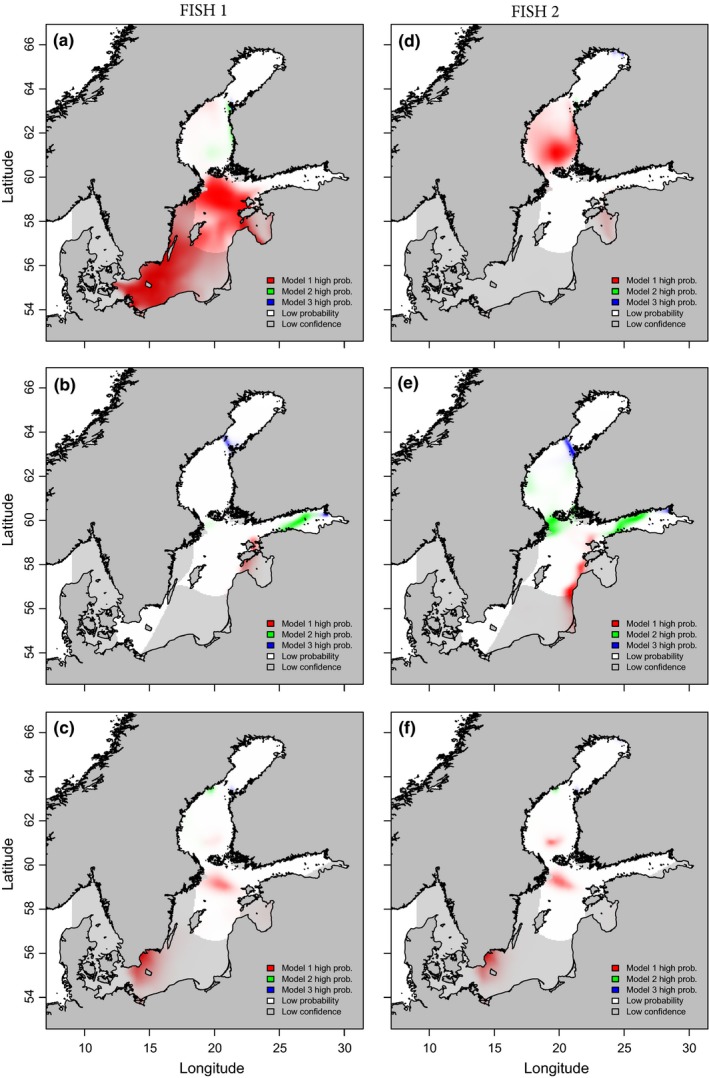
Figure 7.

Probability surfaces of locations for two example River Simojoki Atlantic salmons (FISH 1 and 2) during their feeding phase of first sea winter (1SW; a and d, respectively), second sea summer (2SS; b and e, respectively) and second sea winter (2SW; c and f, respectively) in the Baltic Sea. Calculations are based on salmon otolith and Baltic Sea water δ18O and δ13C values. White and high‐saturation colors indicate that all value surfaces used in the calculation of probabilities (temperature, , δ13 CDIC and prey isotope values) are reliable in contrast to low confidence probabilities indicated in gray and grayish colors. Probability surface results indicated in red represent high probability of presence according to the used model of Hanson et al. (2013) (Model 1), green color indicates high probability or presence with the average model of all four used models in this study (Model 2; Godiksen et al., 2010; Hanson et al., 2013; Patterson et al., 1993; Storm‐Suke et al., 2007) and blue color represents high probability or presence on the model probabilities of Patterson et al. (1993) (Model 3)
