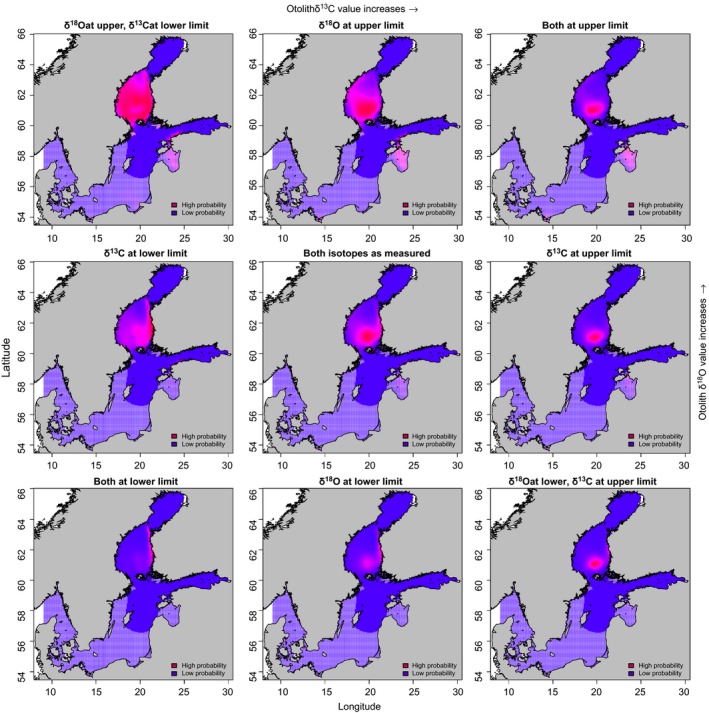
Figure 8.

Sensitivity analysis of probabilistic spatial assignment Model 1 for FISH 2 in 1st winter at the sea (1SW). Original otolith δ18O and δ13C values (figure in the middle) were adjusted ±1SD. High probability means where the probability of obtaining the measured (or deviated) value of the otolith (or the probability of presence of this individual at 1SW) from the created otolith isoscape is the greatest by the used model. The hatched (low‐saturation colored) areas indicate regions where the density of real observations of at least one isoscape (used in the calculation of probability of presence) is too low for reliable prediction
