Figure 2.

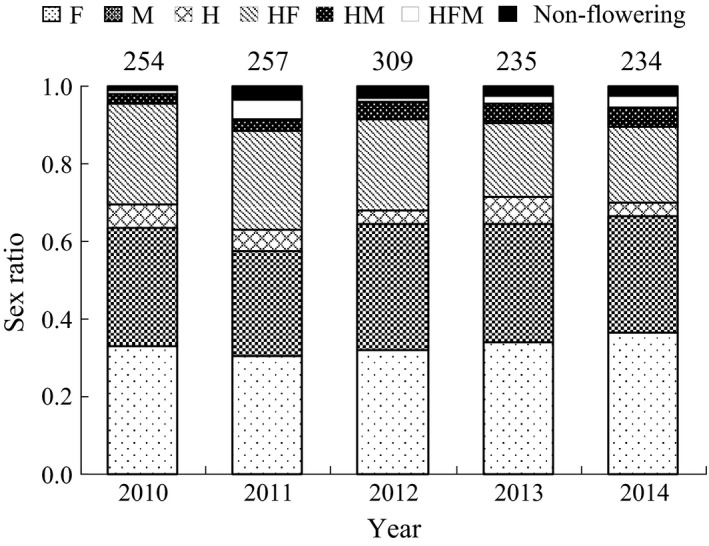
The ratio of six sexual types and non‐flowering in each year from 2010 to 2014 in E. japonica. The number of individuals is indicated above each bar. For the abbreviation of sexual types, see Figure 1

The ratio of six sexual types and non‐flowering in each year from 2010 to 2014 in E. japonica. The number of individuals is indicated above each bar. For the abbreviation of sexual types, see Figure 1