Figure 3.

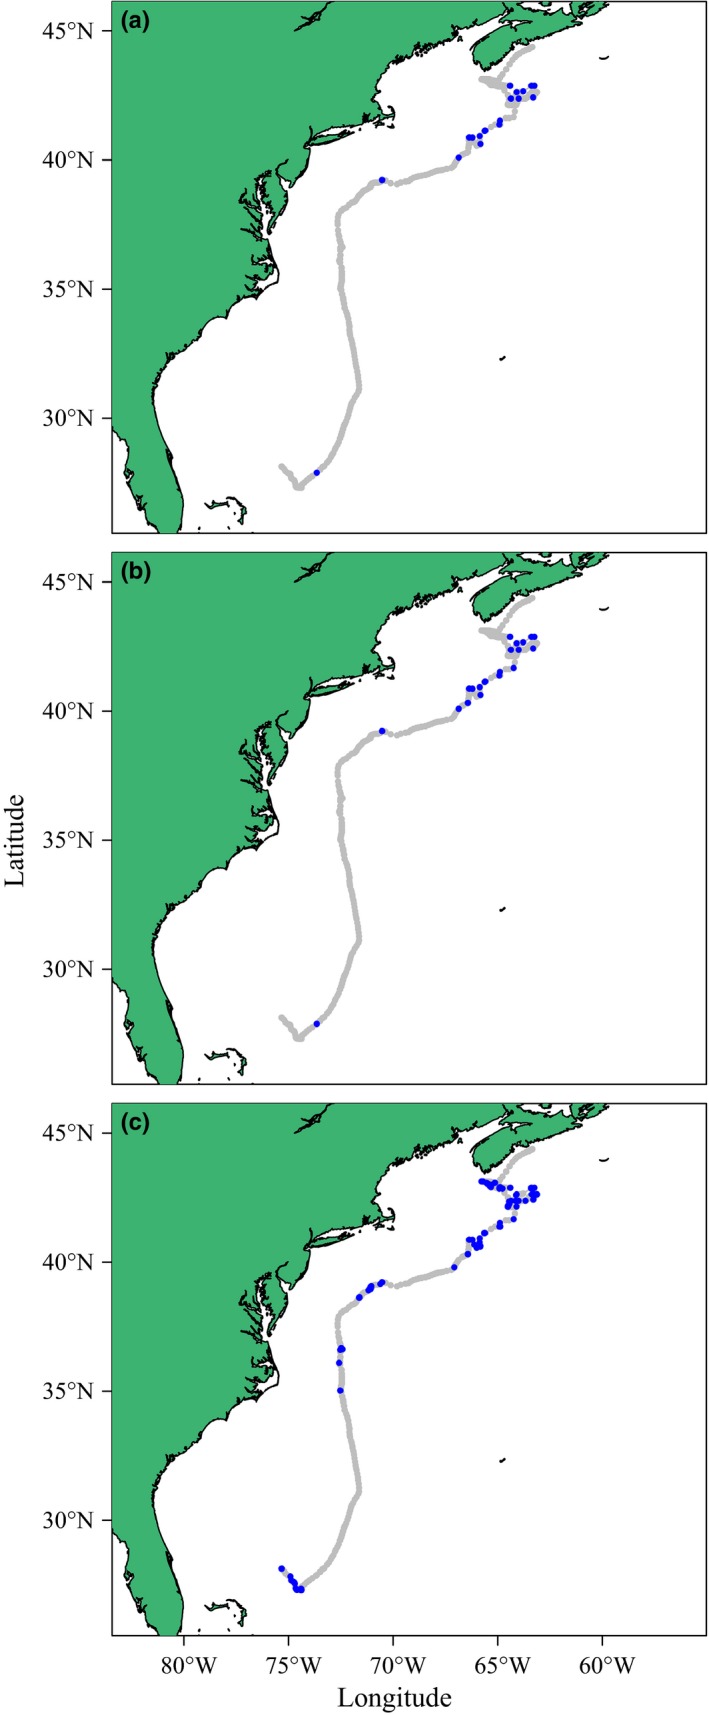
Behavioral states as obtained by fitting the HMMM (panel a), DCRWSNOME (panel b), and moveHMM (panel c) models to the blue shark track. Different behavioral states are indicated by grey (state 1) and blue (state 2)

Behavioral states as obtained by fitting the HMMM (panel a), DCRWSNOME (panel b), and moveHMM (panel c) models to the blue shark track. Different behavioral states are indicated by grey (state 1) and blue (state 2)