
Extended Data Fig. 2. GMP cluster features.
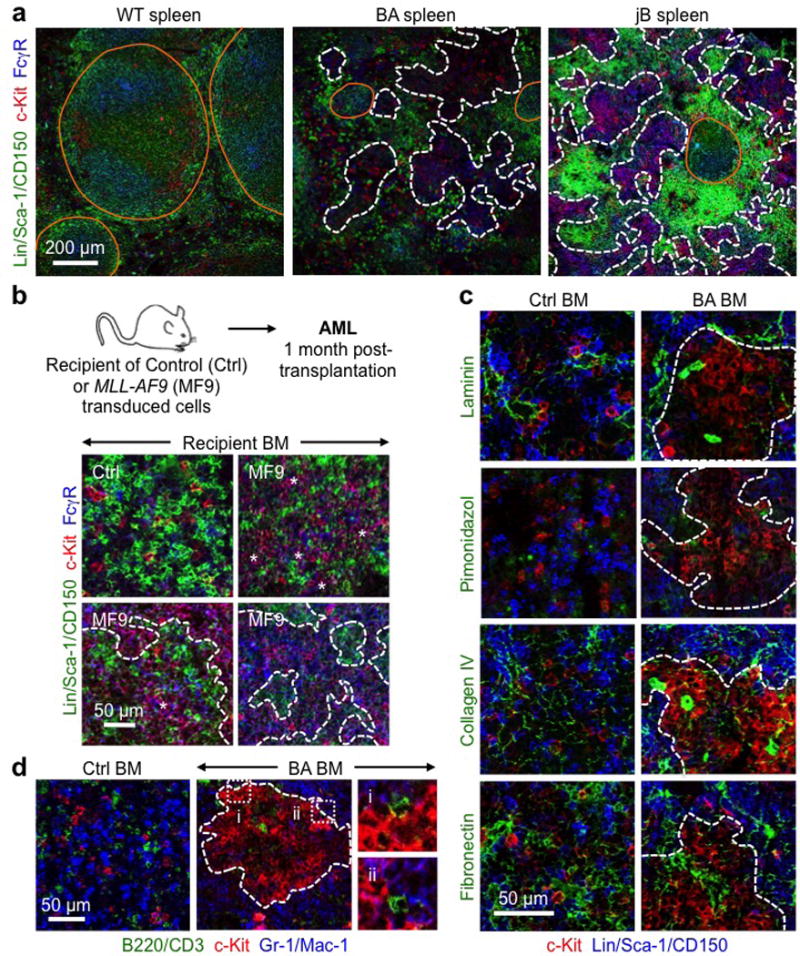
a, Representative IF staining of GMPs (purple) in WT and diseased BA and jB spleens. b, cGMPs in recipient mice developing AML following transplantation of MLL-AF9 (MF9) transduced LSK-derived cells. Experimental scheme and representative IF staining of GMPs (purple) in control (Ctrl) and diseased MF9 recipient BM. Three individual recipient mice are shown for MF9. c, Representative IF staining showing MPs (red) in relation to the indicated stromal features (green) in Ctrl and diseased BA BM. d, Representative IF staining showing MPs (red) in relation to mature lymphoid (green) and myeloid (blue) cells in Ctrl and diseased BA BM. Dotted lines indicate cGMPs; i and ii highlight two magnified areas. Orange lines indicate germinal centers, arrowheads individual GMPs, stars pGMPs and dotted lines cGMPs.