
Extended Data Fig. 4. GMP clusters during myeloid regeneration and expansion.
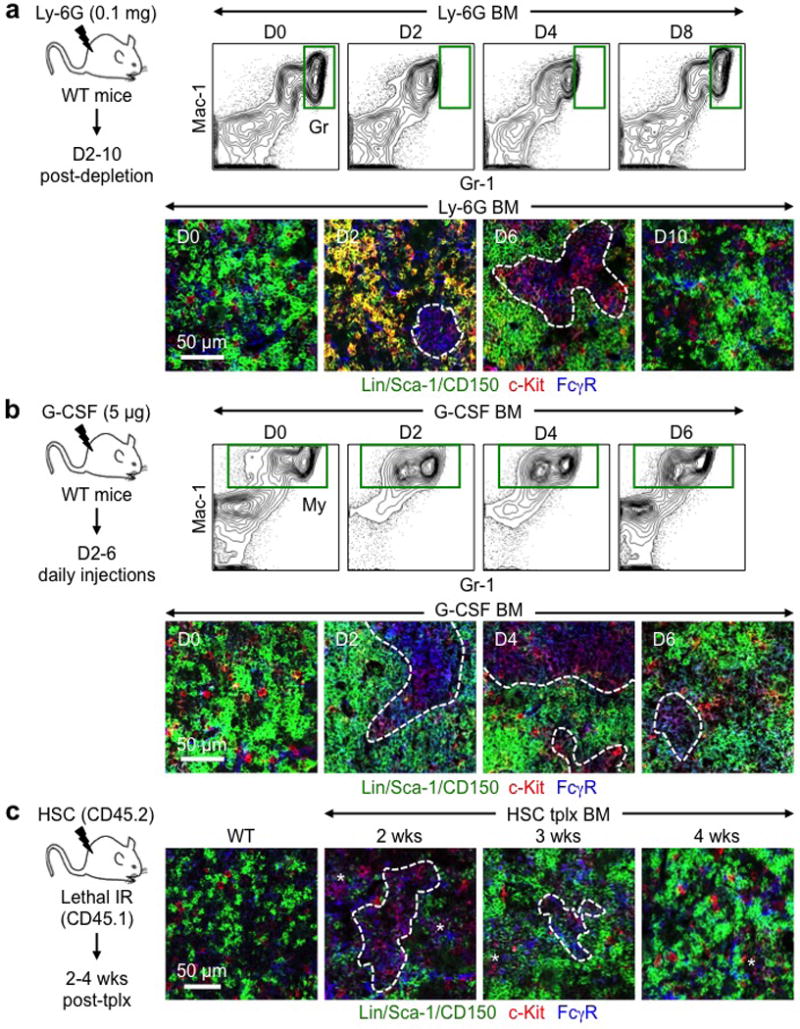
a, Gr depletion in the BM of Ly-6G-treated mice with experimental scheme and representative FACS plots and IF staining of GMPs (purple) at the indicated days post-treatment. b, Gr expansion in the BM of G-CSF-treated mice with experimental scheme and representative FACS plots and IF staining of GMPs (purple) at the indicated days post-treatment. c, GMP clusters in the BM of HSC-transplanted mice with experimental scheme and representative IF staining of GMPs (purple) at the indicated weeks (wks) post-transplantation. Non-transplanted WT BM is shown for comparison. Dotted lines indicate cGMPs and stars pGMPs.