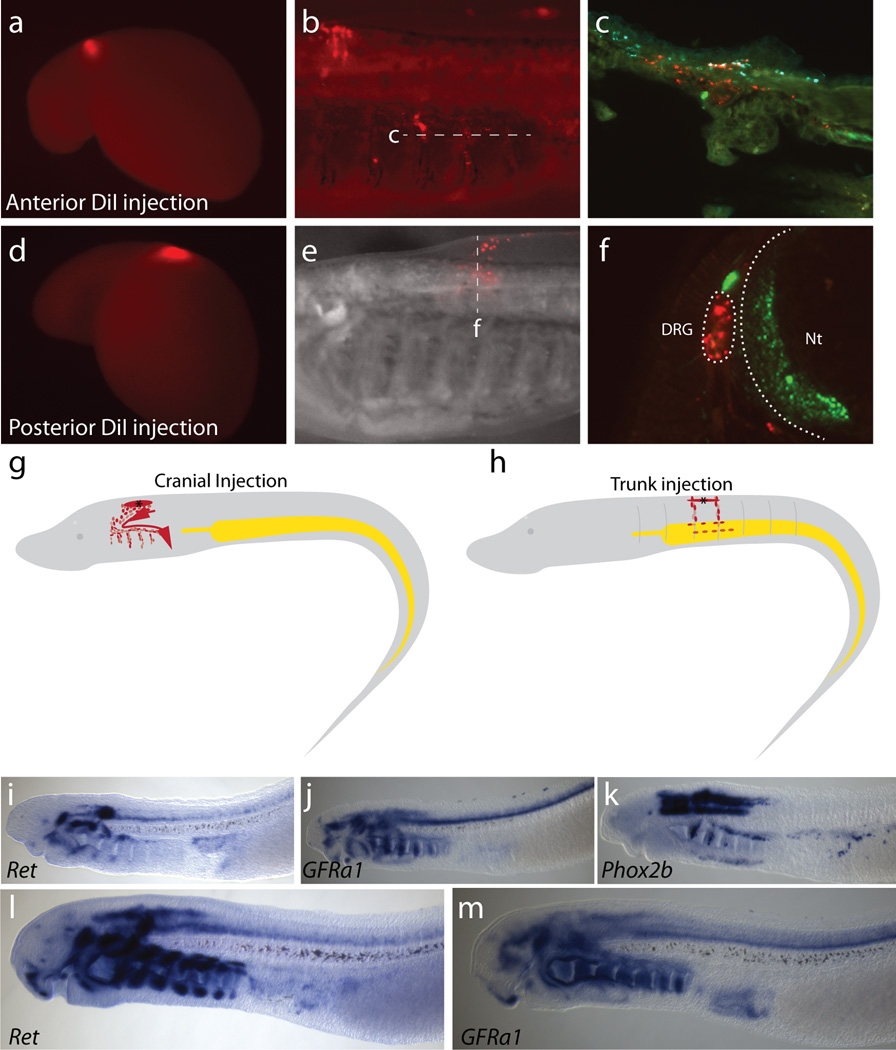
Extended Data Figure 2. DiI labeling of the caudal hindbrain population shows contributions to the branchial arches.
a–c & e–f, Sample time lapse imaging of two separate DiI-labeled embryos around the hindbrain level. a & d, Initial injection at E6-E6.5 (T20). b, Final DiI localization of embryo in A, 10 days post injection (E16). c, Frontal cryosection through the branchial basket shows DiI along the branchial arches. Red: DiI, Green: Neurofilament-M, Cyan: Collagen type II. e, Final DiI localization of embryo in A 14 days post-injection (E20). f, Transverse section through the lamprey branchial basket shows DiI within the DRG. Red: DiI; Green: Neurofilament-M. g–h, Schematic depiction of individual injection sites for cranial (g) and trunk (h) injections. i–m, Genes associated with gnathostome enteric neurons, Ret (i, l), GFRalpha1 (j, m), and Phox2b (k) do not appear to be coexpressed at T26 (i–k) and T27 (l–m), prior to enteric neuron differentiation in lamprey. DRG:dorsal root ganglia; Nt: neural tube.

