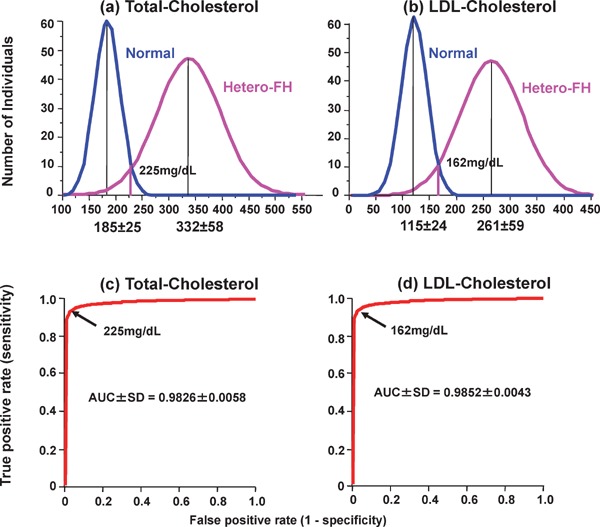
Fig. 11.

Distributions of (a) plasma total cholesterol and (b) LDL-cholesterol in FH and non-FH patients. Receiver operating characteristic (ROC) curves discriminating between FH and non-FH subjects by (c) total cholesterol and (d) LDL-cholesterol are shown. Areas under ROC curves (AUC) are shown as mean ± SD.
