
Table 2a. Association of Subjective/ Self-reported and Objective Sleep Duration with Coronary Artery Calcium (CAC).
| First Author, Publication Year, Study Type |
Sleep Measurement | Non-Invasive Subclinical CVD assessment tools. |
Results | Comments |
|---|---|---|---|---|
| Subjective/Self-reported Sleep Duration | ||||
| King et al. (33), 2008 | Self-Report (PSQI) | CAC | Logistic regression of incident CAC [OR (95% CI): Self-reported sleep per hour (Adja): 0.87 (0.67–1.13), p = 0.30 |
|
| Matthews et al. (31), 2011 | Self-Report (PSQI), | CAC | Self-reported Sleep duration (hr) among CAC groups: CAC= 0: 6.41 (1.25) CAC= 1 – 99: 6.51 (1.18) CAC= 100 +: 6.48 (1.19), p = 0.88 |
|
| Matthews et al. (32), 2013 | Self-Report (PSQI) | CAC | No significant association between longer self-reported sleep duration and increased CAC in linear (p = 0.19) or logit models (p = 0.06) |
Women only sample |
| Kim et al, 2015 (17) | Self-Report (PSQI) | CAC | Sleep duration vs. CAC Score (Adjb): OR (95% CI) ≤ 5 h: 1.50 (1.17 – 1.93); p: 0.002 6 h: 1.34 (1.10 – 1.63); p: 0.002 7 h: 1.00 (Reference) 8 h: 1.37 (0.99 – 1.89); p: ≥ 0.05 ≥ 9 h: 1.72 (0.90 – 3.28); p: 0.002 |
The association between sleep duration and CAC is “U-shaped”. |
| Objective Sleep Duration | ||||
| King et al. (33), 2008 | Actigraphy | CAC | Logistic regression of incident CAC [OR (95% CI): Actigraph measured sleep per hour (Adjc): 0.66 (0.48 – 0.92), p = 0.01 | |
| Matthews et al. (31), 2011 | Actigraphy, Polysomnography | CAC | Objective sleep duration (hr) among CAC groups: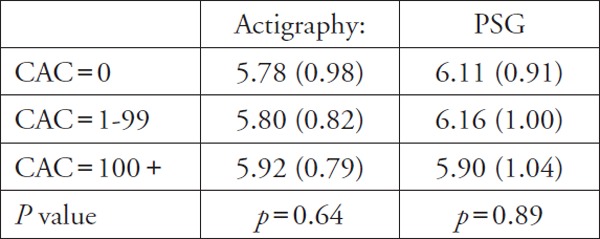
|
Sleep duration both by Actigraphy and PSG was not significant |
| Lutsey et al (34), 2015 | Polysomnography and actigraphy | CAC | Sleep duration (h) vs CAC ≥ 400: PR (95% CI): ≤ 6.65h: 0.75 (0.55–1.03), p = 0.08 6.65–7.4 h: Ref ≥ 7.40h: 0.84 (0.56–1.26), p = 0.40 |
Fully adjusted model is not related to high prevalence of CAC. |
a
Adjusted for race, sex, age, smoking, education, and apnea risk
b
Adjusted for age, sex, study center, year of visit, education, marital status, depression, smoking status, alcohol consumption, physical activity, body mass index, fasting glucose, systolic blood pressure, diastolic blood pressure, height, and hear rate.
c
Adjusted for race, sex, age, smoking, education, apnea risk, BMI, HDL, LDL, BP, DM