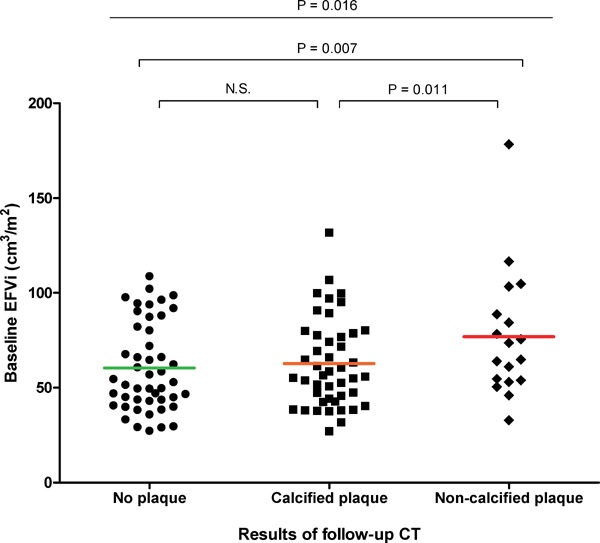
Fig. 1.

Differences in EFVi according to follow-up CT results
Baseline EFVi was significantly higher in participants who had NCP on follow-up CT than participants who had CP or no plaque on follow-up CT. P-values were calculated by ANCOVA with age, sex, HTN, DM, Framingham risk score, BMI, and central obesity as covariates.
Abbreviations: EFVi, epicardial fat volume index; CT, computed tomography; HTN, hypertension; DM, diabetes mellitus; NCP, non-calcified plaque; CP, calcified plaque; ANCOVA, analysis of covariance; BMI, body mass index.
