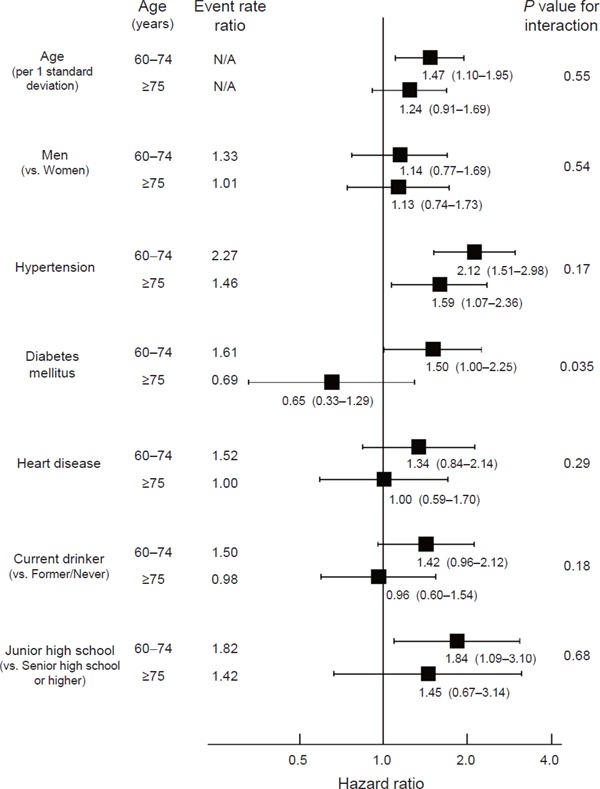
Fig. 1.

Event rate and hazard ratios for stroke incidence among participants aged 60–74 years (n = 1, 520) and ≥ 75 years (n = 563)
Event rate ratios were calculated based on crude event rate in each subgroup, while hazard ratios were adjusted for all other variables. Filled squares represent point estimates and horizontal lines denote the 95% confidence interval. Age per 1 standard deviation corresponded to 7.6 years. P denotes the significance of interaction between age categories (60–74 years and ≥ 75 years) and each variable.
