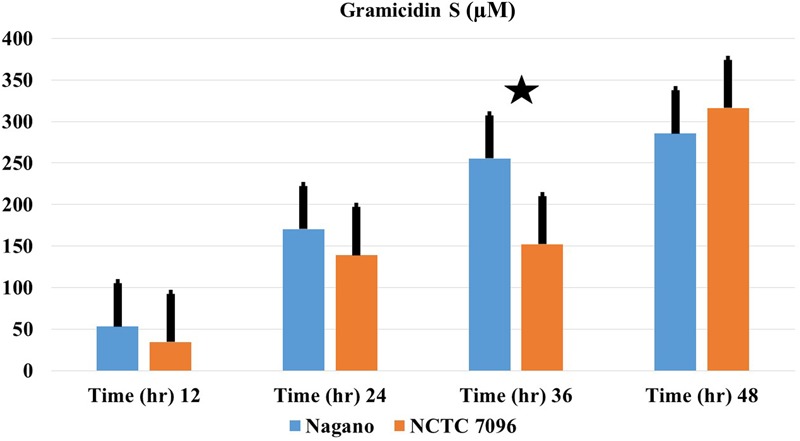
FIGURE 4.

Production of GS-1141 by A. migulanus Nagano ( ) and A. migulanus NCTC 7096 (
 ). Vertical bars represent standard errors of the means, (N = 3). Data presents mean ± standard error. Bars labeled with asterisk are significantly different among the treatments at P < 0.05 using ANOVA analysis.
