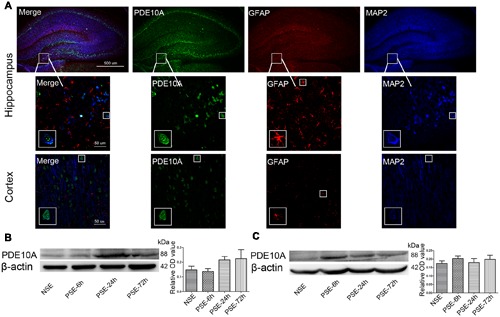
FIGURE 1.

PDE10A expression in the hippocampus and cortex of rats. (A) Triple-label immunofluorescence demonstrated that PDE10A (green) and GFAP (red) were not co-expressed in astrocytes, but PDE10A (green) and MAP2 (blue) were co-expressed in neurons (n = 5). The white squares indicate positive cells in the cortex or hippocampus of rats. Representative Western blot images of hippocampus (B) and cortex (C) of rats at different time points post-status epilepticus. PDE10A increased after SE with a trend, but not significantly (non-SE; 6 h post-SE, PSE-6; 24 h post-SE, PSE-24; 72 h post-SE, PSE-72; n = 5, P > 0.05).
