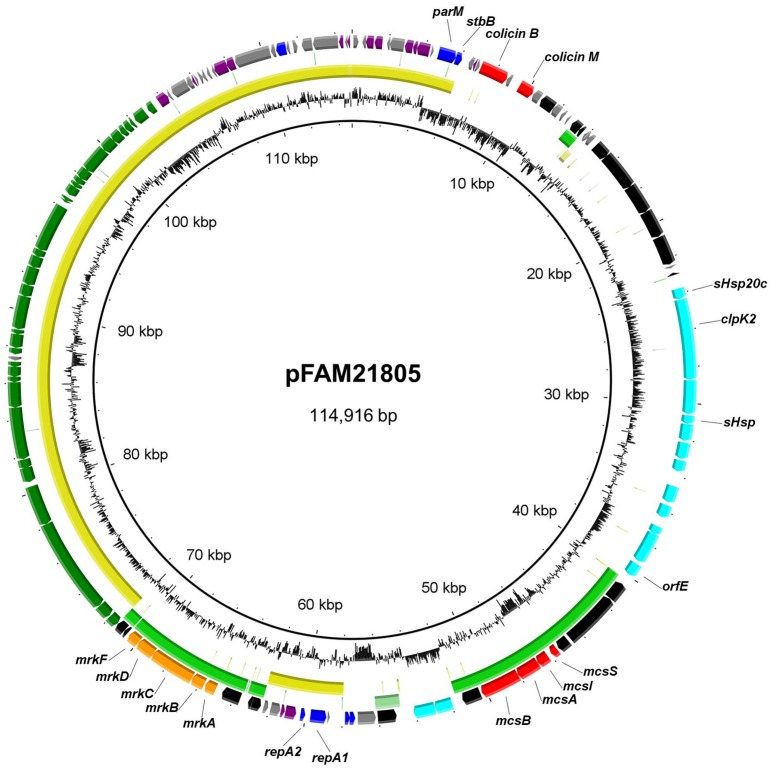
Figure 2.
Circular representation of pFAM21805 and BLASTn comparison of plasmids with shared regions. The outer ring shows predicted ORFs. Colors represent different putative functions: Gray, hypothetical proteins; blue, plasmid replication and maintenance; red, bacteriocins and accessory genes; light blue, LHR2 genes; orange, adhesins; dark blue, regulatory genes; purple, miscellaneous; and black, mobile elements. Within circles two (pCPO13026, yellow) and three (pSYM1, green), the darkest color indicates nucleotide identity exceeding 90%, whereas the lightest color represents identity exceeding 80%. Innermost circle, G+C content. The circular map was generated using BRIG.

