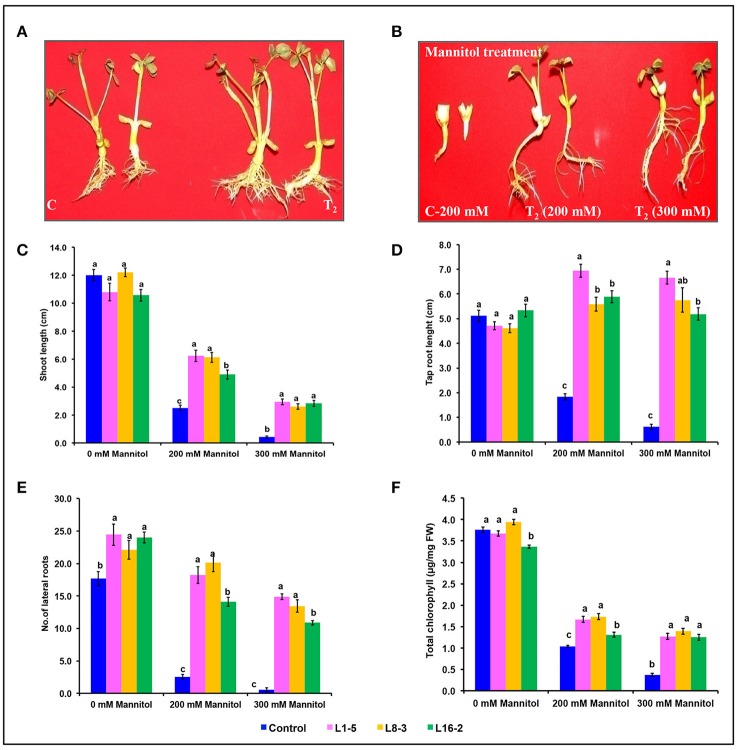
Figure 5.
Characterization of eIF4A groundnut transgenic plants under simulated drought stress conditions. (A) Growth performance of PgeIF4A expressing transgenic plants (T2) and control (C) on plain MS medium. (B) Graphical representation of growth performance transgenic plants (T2) and control (C) on 200 and 300 mM mannitol. (C) Relative shoot length in cm. (D) Tap root length in cm. (E) Number of lateral roots. (F) Chlorophyll retention of transgenic and control plants grown under 0, 200, and 300 mM mannitol medium. All the experiments performed in triplicates and data represented as mean (n = three biological triplicates) using two way ANOVA with LSD and P < 0.005. Different alphabets indicated the significant differences between the treatments. Similar letters denotes non significant.

