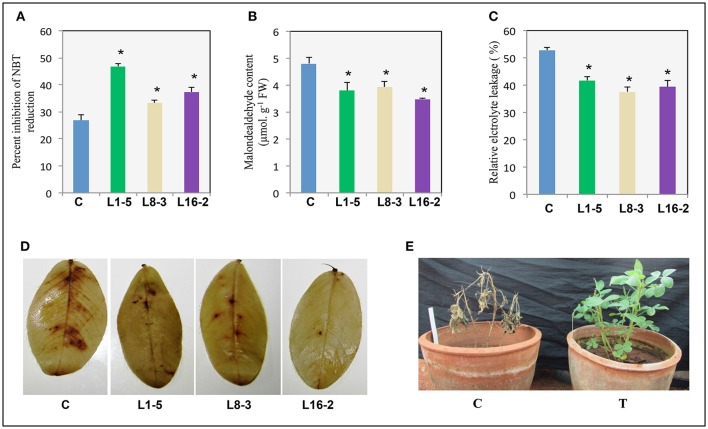
Figure 8.
Response of transgenic plants expressing PgeIF4A to salinity stress. One month old control and transgenic plants were imposed with salinity stress (250 mM NaCl) for 2 weeks. (A) SOD activity (% inhibition of NBT). (B) Lipid peroxidation (malondialdehyde content). (C) Relative electrolyte leakage percentage. (D) DAB (3,3′-Diaminobenzidine) staining of WT and transgenic groundnut leaves. (E) Control (C) and PgeIF4A expressing transgenics (T) allowed to recovery after salinity treatment. Data represented as mean of ±SE (n = 3) using one way ANOVA. *Denotes significant difference between WT treated and transgenics (L1-5, L8-3, and L16-2) at p < 0.05.

