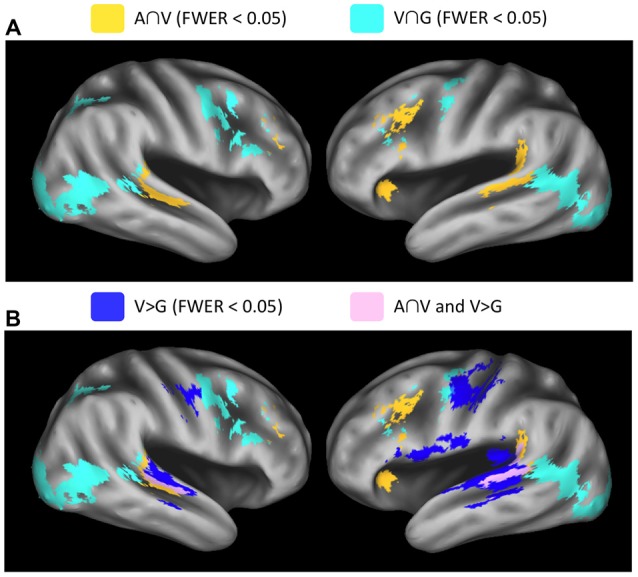
Figure 4.

Whole-brain conjunction analyses. (A) Group-level conjunction results plotted on an inflated surface rendering of the study-specific template in MNI space. Significant responses during visual speech and nonspeech facial gestures (V∩G, teal) were observed in the posterior STS. Significant responses during auditory speech and visual speech (A∩V, yellow) were observed the middle STS (mSTS). (B) Conjunction analyses are plotted together with the contrast V vs. G (blue), which highlights regions that activate preferentially to visual speech vs. nonspeech facial gestures. These visual-speech-specific regions fall anterior to V∩G in the STS and overlap strongly with A∩V (pink). All maps were thresholded at voxel-wise p < 0.005 (uncorrected) with a cluster-extent threshold of 185 voxels (FWER corrected p < 0.05).
