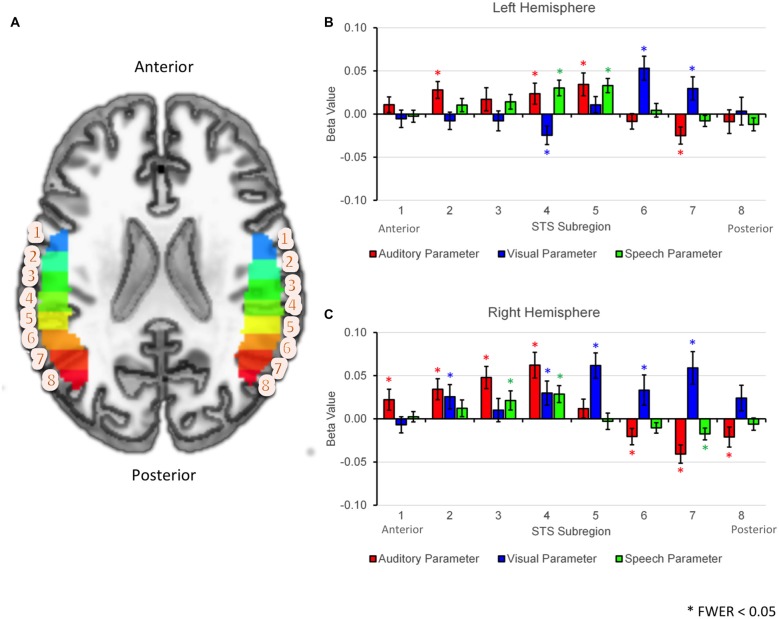
Figure 5.
ROI analyses based on linear mixed effects modeling. (A) Axial cut-away rendering of the study-specific template in MNI space showing left and right hemispheres overlaid with probabilistically defined STS regions of interest. Individual STS subregions have been color-coded (arbitrary colormap) and numbered 1–8 moving anterior to posterior. (B,C) Results of the generalized linear mixed model (GLMM) analysis are plotted by subregion number separately for the left (B) and right (C) hemispheres. Group average fixed effects of the auditory parameter (AP), visual parameter (VP) and speech parameter (SP) are given by the heights of the red, blue and green bars respectively. Effects are shown separately for each STS subregion (1–8, horizontal axis). Significant effects (FWER corrected p < 0.05) are each marked with an asterisk. Error bars reflect 1 SEM.

