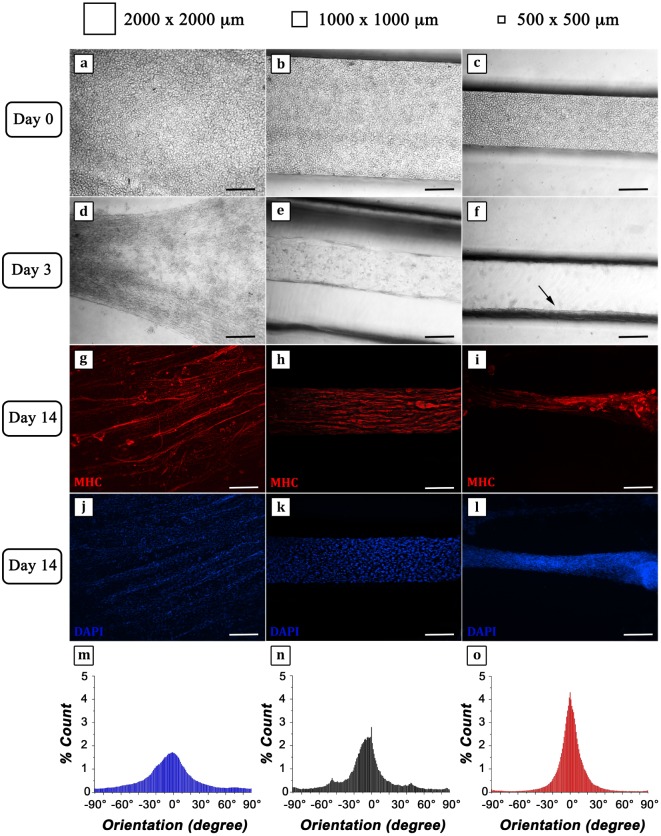
Figure 5.
C2C12 cells encapsulated into 4% GelMA at different degrees of geometrical confinement. (A–F) Phase contrast micrographs of C2C12 captured 24 h (A–C) and 72 h (D–F) after cross-linking. From left to right: 2,000 μm × 2,000 μm; 1,000 μm × 1,000 μm; 500 μm × 500 μm. Black arrow in (F) indicates myostructure shrinkage occurring in the thinner structure. (G–L) Immunofluorescence (IF) against myosin heavy chain (MHC) (red) (G–I) following 14 days culture; nuclei were counterstained by DAPI (blue) (J–L). Scale bars: 100 µm. (M–O) Myotube orientation distribution plots (with 0° corresponding to the direction of the major axis of symmetry of each hydrogel structure) calculated from IF micrographs (MHC signal).

