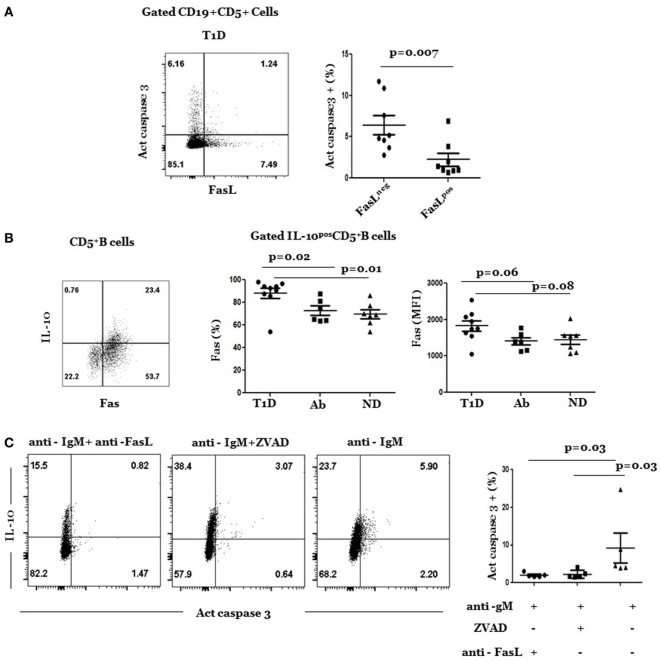
Figure 4.
Resistance of FasLpos CD5+ B cells to activation-induced cell death. (A) Cryopreserved splenocytes from type 1 diabetes (T1D) donors were thawed and stimulated with anti-IgM at 37°C for 24 h and analyzed for expression of active caspase 3 and FasL as detailed under Section “Materials and Methods.” Left, representative dot plot shows expression of active caspase 3 and FasL by gated CD5+ B cells. Right, graph shows cumulative data of frequency of caspase 3+ cells among gated FasLpos and FasLneg subpopulations of CD5+ B cells. Symbols represent individual donors. Data are expressed as mean ± SEM; p < 0.05 is statistically significant. (B) Percentage and levels (MFI) of Fas expression are significantly higher in IL-10+ CD5+ B cells in T1D than in Ab+ and ND subjects. Splenocytes from indicated donors were rapidly stimulated with phorbol myristate acetate/ionomycin and analyzed for intracellular IL-10 and Fas surface expression as described under Section “Materials and Methods.” Left, representative dot plot shows expression of IL-10 and Fas by gated CD5+ cells. Right, graphs show percentage (left) and mean fluorescent intensity (MFI) of Fas (right) on IL-10+ CD5+ B cells in subjects from the three groups. Data are expressed as mean ± SEM; p > 0.05 is statistically significant. (C) Cryopreserved splenocytes from T1D subjects were thawed and stimulated at 37°C with anti-IgM in the presence of FasL-neutralizing (RNOK203), the global apoptosis inhibitor, ZVAD, or in medium alone. After 24 h, cells in each culture were stained, and gated CD5+ B cells were analyzed for expression of active caspase 3 and IL-10. Left, dot plots show representative expression of active caspase 3 and IL-10 on gated CD5+ B cells under the different culture conditions. Right, graph shows cumulative data of percentage of IL-10+ CD5+ B cells that expressed active caspase 3 under each condition. Each symbol represents a subject (n = 5). Data was analyzed using Wilcoxon Matched pair sign rank test. Data are expressed as mean ± SEM; p < 0.05 is statistically significant.

