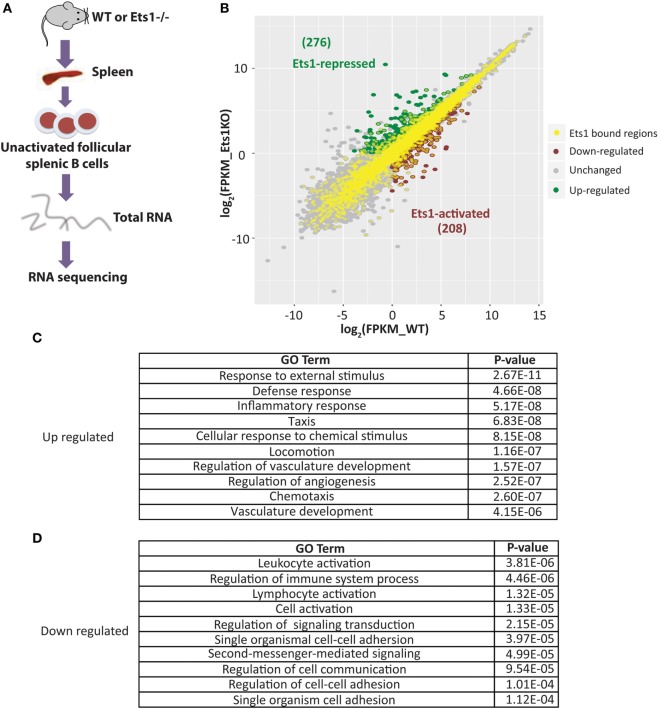
Figure 3.
Identification of genes whose expression in B cells requires Ets1. (A) Scheme to isolate naive follicular B cells from the spleens of wild-type (WT) and Ets1−/− mice (n = 2 samples/genotype). (B) Scatterplot analysis of differential gene expression in WT and Ets1−/− B cells. Genes that are upregulated (Ets1-repressed) in Ets1−/− cells are shown as green dots, while genes that are downregulated (Ets1-activated) are shown as red dots. Gray dots are genes whose expression does not change and/or whose expression is less than 1.0 FKPM in both cell types. Dots with yellow centers are the genes that show an associated Ets1-binding site by ChIP-seq. Pathway analysis of genes repressed (C) and activated (D) by Ets1. The top 10 GO terms ranked according to p-value are shown for both Ets1-repressed and Ets1-activated genes.

