Figure 3.
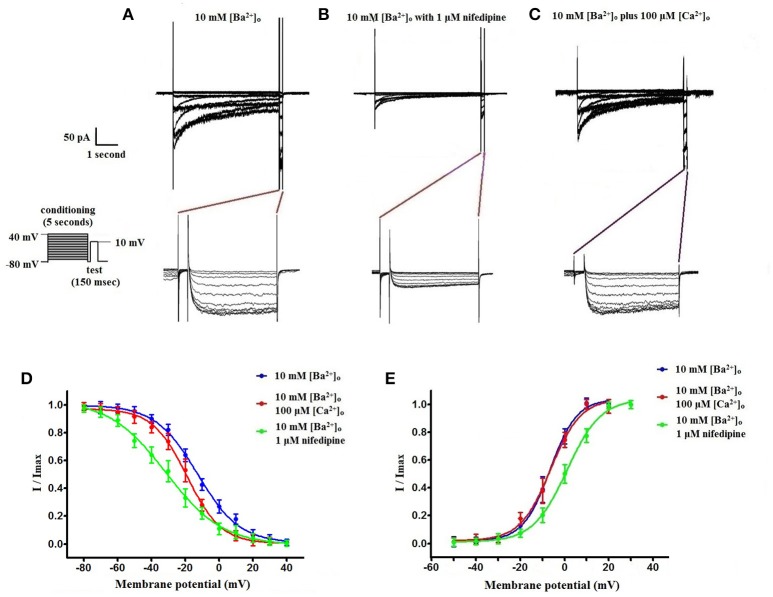
Voltage-dependent inactivation and activation characteristics of VDCC currents recorded in 10 mM [Ba2+]o ± 100 μM [Ca2+]o. (A–C) Current recordings obtained from cells using a double-step voltage protocol that applied a 5 s conditioning pulse step to examine steady-state VDCC inactivation. Recordings obtained in extracellular solution containing 10 mM [Ba2+]o (A), 10 mM [Ba2+]o with 1 μM nifedipine (B), and 10 mM [Ba2+]o plus 100 μM [Ca2+]o (C). (D) Steady-state inactivation curves obtained using the voltage protocol illustrated in (A–C). (E) VDCC activation curves derived from currents elicited by successive 10 mV depolarizing voltage steps from a holding potential of −80 mV.

