FIGURE 2.

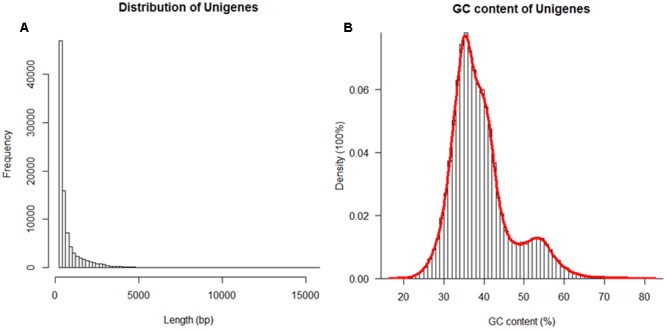
Histograms of the length (A) and the GC content of total assembled sand rice Unigenes. The red line in (B) indicates the density distribution.

Histograms of the length (A) and the GC content of total assembled sand rice Unigenes. The red line in (B) indicates the density distribution.