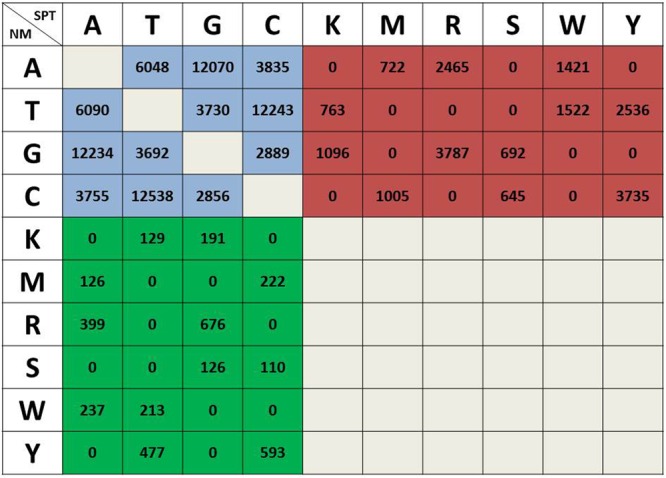
FIGURE 3.

Classification and statistical analysis of pairwise SNPs between sand rice individuals from the NM and SPT regions. The three different background colors represent three types of pairwise SNPs between the two individuals and the number of each type of SNP is presented in each cell. Blue, inter-individual SNPs; green, NM specific SNPs; red, SPT specific SNPs. K, T/G; M, A/C; R, A/G; S, G/C; W, A/T; Y, T/C.
