
FIGURE 6.
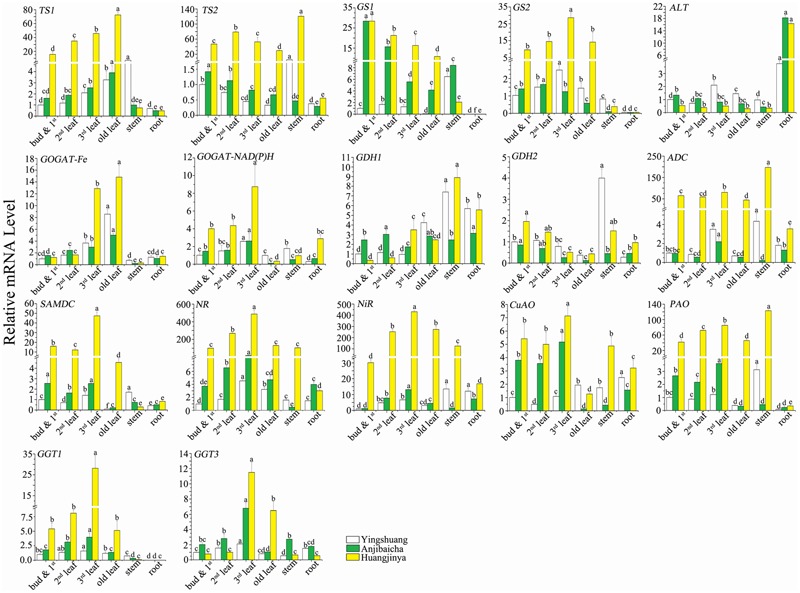
Expression profiles of L-theanine metabolism related genes among various tissues of C. sinensis cultivars ‘Huangjinya’, ‘Anjibaicha’, and ‘Yingshuang’. The gene mRNA level of bud and 1st leaf in ‘Yingshuang’ is defined as 1. The different lowercase letters on the bar graph indicate significant differences at P < 0.05.