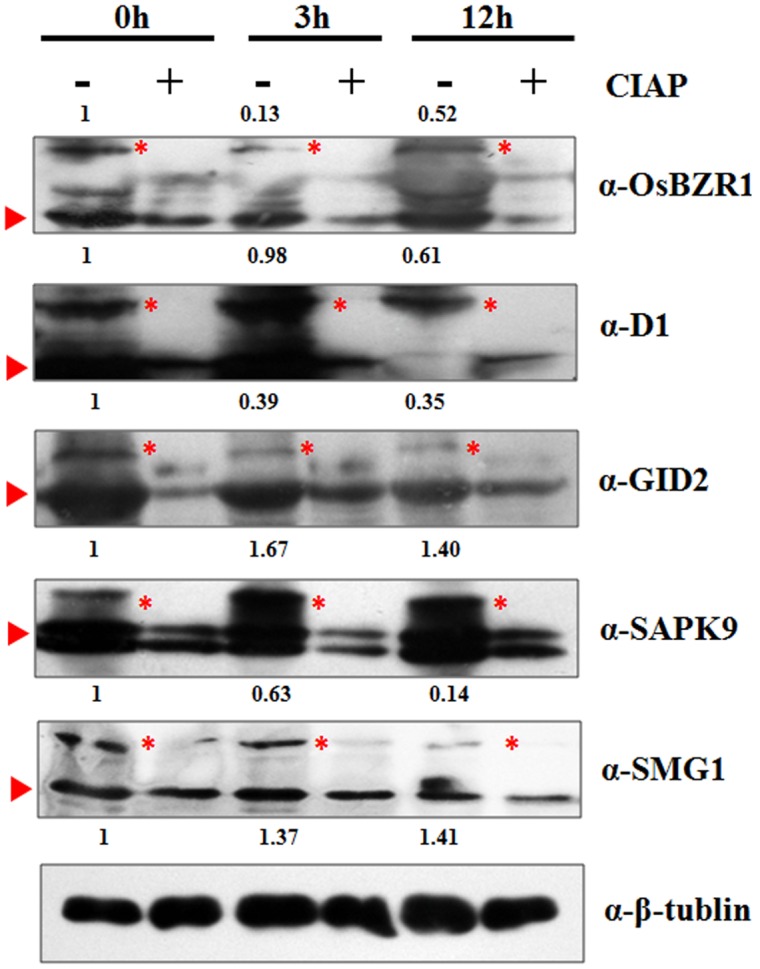
FIGURE 5.

Western-blot analysis of five selected proteins to verify the MS identified phosphorylation pattern at 0, 3, and 12 h. Red triangle indicates the target band in original size; Red asterisk indicates the phosphorylated target protein band. Anti-tubulin was used as an internal control for normalization. The values above the phosphorylated bands represent the normalized, relative band intensities by setting 0 h into 1.
