Figure 2.

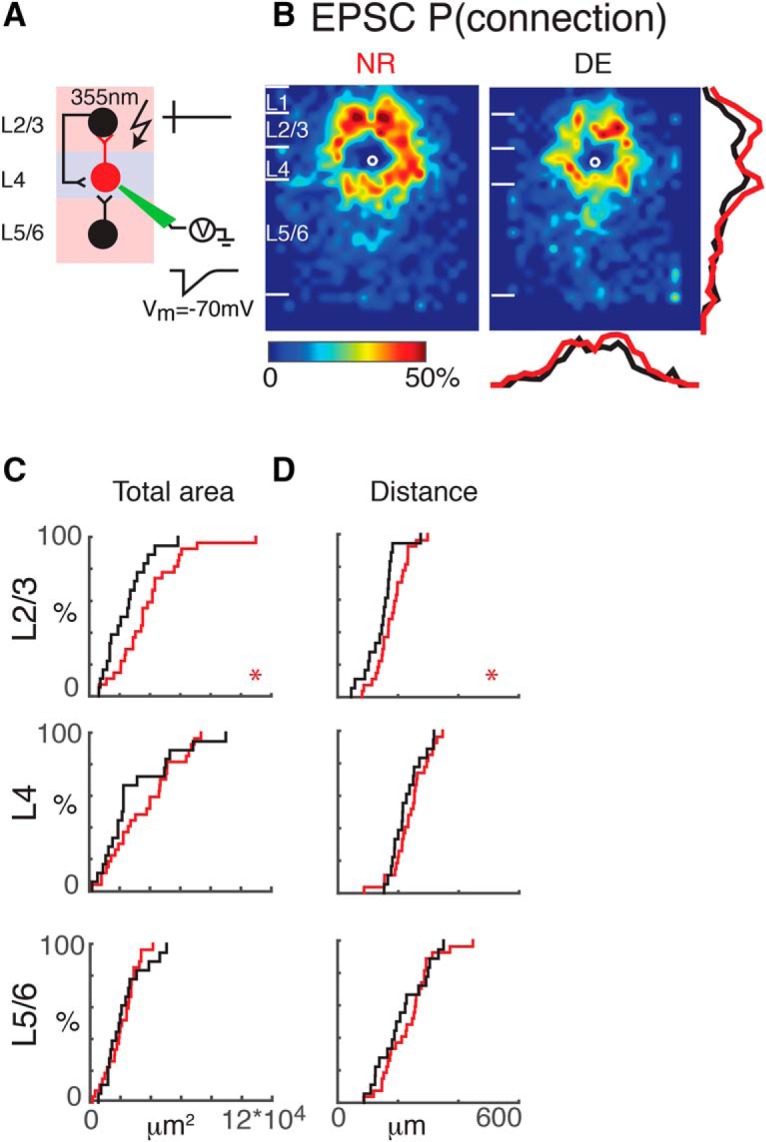
Interlaminar cortical excitatory connections to L4 cells refine with DE. A, Schematic of LSPS experiment. Whole-cell patch-clamp recordings are made from L4 neurons. Cells are held at –70 mV. Laser pulses (355 nm) are targeted to an array of locations in the slice. Traces on right, activated cells fire action potentials (top), and if a connection exists to the patched L4 neuron, evoked EPSCs are recorded (bottom). B, Average maps (aligned to soma, white circle) of connection probability for excitatory connections in NR (left) and DE (right) animals. Connection probability is encoded according to the pseudocolor scale. White horizontal lines indicate averaged laminar borders and are 100 μm long. Traces at the right of the DE panel the laminar marginal distributions (red for NR and black for DE). Traces at the bottom of the DE panel are the columnar marginal distributions. Note that NR and DE maps and distributions appear different. C, Distributions of area of input originating from L2/3 (top), L4 (middle), and L5/6 (bottom) of NR (red) or DE (black) animals. *, p < 0.05. The p values for the total area from L2/3, L4, and L5/6 are 0.02 (NR: mean = 3.8 × 104 μm2, std = 2.2 × 104 μm2; DE: mean = 2.4 × 104 μm2, std = 1.4 × 104 μm2), 0.74 (NR: mean = 2.1 × 104 μm2, std = 1.0 × 104 μm2; DE: mean = 2.2 × 104 μm2, std = 1.3 × 104 μm2), and 0.32 (NR: mean = 3.6 × 104 μm2, std = 2.1 × 104 μm2; DE: mean = 2.9 × 104 μm2, std = 2.4 × 104 μm2), respectively. D, Distributions of the distance of 80% of input to each L4 cell originating from L2/3 (top), L4 (middle), and L5/6 (bottom) of NR (red) or DE (black) animals. We calculated the laminar radius that covers 80% of inputs inside each layer and plotted the CDFs of the radius. *, p < 0.05. All comparisons were done with Wilcoxon rank-sum test or Student’s t test. The p values for the average 80% distance from L2/3, L4, and L5/6 are 0.028 (NR: mean = 179.2 μm, std = 51 μm; DE: mean = 143.6 μm, std = 52.3 μm), 0.40 (NR: mean = 239.4 μm, std = 58.7 μm; DE: mean = 225.2 μm, std = 49.9 μm), and 0.39 (NR: mean = 233.5 μm, std = 79.8 μm; DE: mean = 212.2 μm, std = 81.0 μm), respectively.
