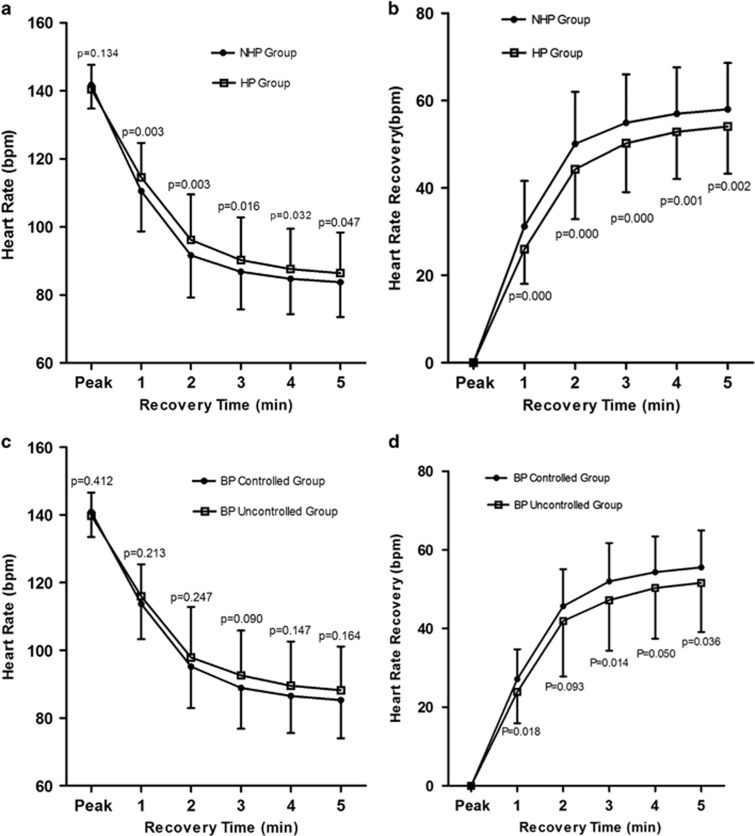
Figure 1.
(a, b) HR change and HRR change post-exercise for the HP and NHP groups; (c, d) HR change and HRR change post-exercise for the BP uncontrolled and BP controlled groups. P-values at individual data points represent the P-value between groups at that specific time point. The data are shown as the mean±s.d.

