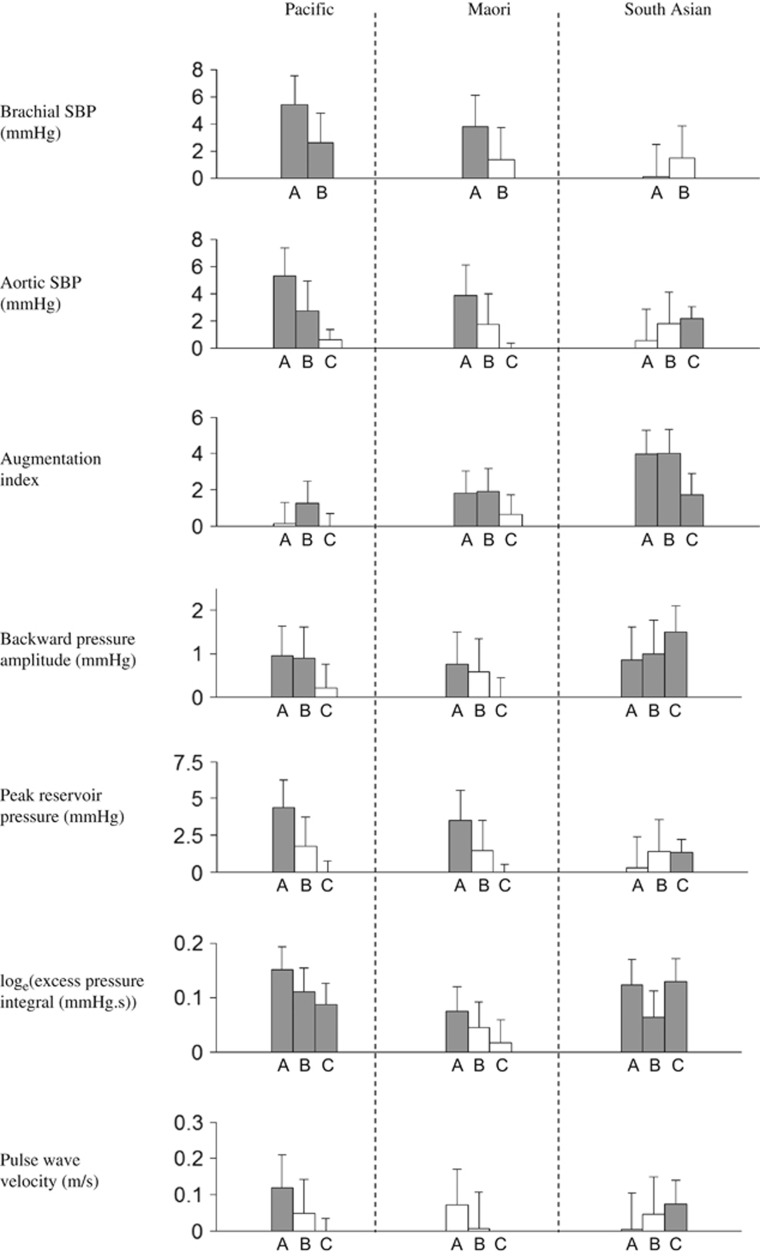
Figure 1.
Ethnic differences, compared with Europeans, in arterial waveform parameters. Bar A covariates are age, sex, antihypertensive use, diabetes and cardiovascular disease, plus pulse rate for augmentation index. Bar B covariates are bar A covariates plus heavy alcohol consumption, smoking and BMI. Bar C covariates are bar B covariates plus mean arterial pressure, pulse rate, height and total:HDL cholesterol ratio. Grey and white bars represent significant and non-significant differences, respectively. Error bars represent the upper values of the 95% confidence intervals.

